This is a level 3 statistics activity from the Figure It Out series.
A PDF of the student activity is included.
Click on the image to enlarge it. Click again to close. Download PDF (1236 KB)
construct a table
construct a graph
interpret information from the graph
make conclusion from the data
This diagram shows the areas of Statistics involved in this activity.

The bottom half of the diagram represents the 5 stages of the PPDAC (Problem, Plan, Data, Analysis, Conclusion) statistics investigation cycle.
Statistical Ideas
People Meters involves the following statistical ideas: collating numeric data, drawing andinterpreting stacked bar graphs, inventing graphs, evaluating the effectiveness of different data displays, and identifying possible “dirty data”.
A computer spreadsheet/graphing program
FIO, Levels 3+ -4, Statistics in the Media, People Meters, pages 8-9
A classmate
Background Information
Students will need to understand what a people meter is and what it is used for. For this, they can go to The New Zealand Television Broadcasters’ Council website for more information on people meters and for the statistics gleaned from them. Note that a real people meter records more information than the activity suggests, including the channel watched and exact times. This information is collected by market research companies for media companies to use. Visit www.agbnielsen.co.nz and click on What do we do? This allows you to explore the systems this company uses to collect and analyse data. It provides a very interesting model for statistical investigations in the professional context.
Activity One
Data often needs to be analysed and graphed in a variety of ways, with the focus on different variables or features, in order to discover patterns and trends. This usually involves grouping and regrouping data in different ways. For this activity, the students may need the change from 30-minute to 2-hourly slots pointed out to them.
For questions 2 and 3, encourage your students to design their own graphs to display the data. If a graph is to be able to tell a variety of stories, data loss needs to be minimised. For this reason, pie charts are not suitable for this sort of data because they convey only one feature of a data set and leave no details for the reader to pore over. Have the students evaluate each others’ graphs in terms of their effectiveness in helping to communicate the findings.
For question 4, the students may realise that the guest was probably a babysitter (which explains their lone viewing on Saturday night) and that Zoë evidently forgot to log off when she finished viewing on Wednesday night. Although it is not until level 5 that students are expected to identify “dirty” data and clean it, the concept can be introduced at an earlier level. Dirty data might be an input error (such as a height recorded as 157 metres instead of 1.57 metres) or a deliberately false survey answer (such as giving “Jedi Knight” as one’s religion). In this case, it is unlikely that Zoë watched TV all Wednesday night, so this needs to be considered (or possibly
adjusted for) when analysing this data. (We don’t know if the guest was the babysitter or a friend who forgot to log off, so this data cannot be “tidied”.)
For question 5, the data for 1 week is a sample size of one family. There will be considerable variation from week to week for the family’s viewing, so many more weeks’ data would be needed before it was possible to say what was typical for the Wade family.
For question 6, the students need to realise that the data collection agency cannot tell whether people are actually watching the shows they are logged on to. This needs to be kept in mind when interpreting viewer information collected in this way.
Activity Two
Have the students revisit the websites cited above for further information and to spark discussion on the viewing habits of the nation. Further investigative questions could be formulated, based on the much more extensive set of data available.
Extension
Have the students carry out a class-wide investigation into family viewing habits. They will need to decide what data they will collect, when they will collect it (for example, during a certain 5-hour slot on 1 or more days), and how they will record it. (They need to make sure that they get permission from family members to use this data!)
When the students have collected their own family’s data, have them collate and graph it, using different graphs. What patterns can they see? What conclusions can they reach? Have them compare their findings with those of a classmate and then pool the data from the whole class. Ask them what conclusions they can make now.
Answers to Activities
Activity One
1.
.gif)
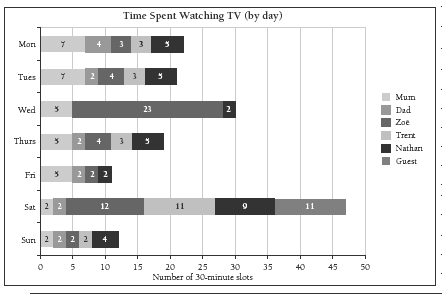
2. a. Graphs will vary. One way of presenting each person’s viewing time by day is in a horizontal stacked bar graph like this:
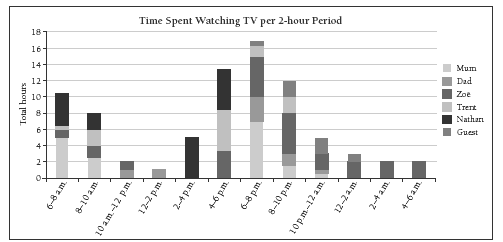
One way of presenting people’s viewing time broken down by time of day (in 2-hour periods) is in a vertical stacked bar graph like this:
Comments will vary. For example, from the first graph, you can say that Saturday
was the most popular viewing day and that Fridays and Sundays were the least
popular. You would, however, want to question the large number of 30-minute
time slots (23) recorded on Wednesday as being watched by Zoë. (What would the
graph tell you if she had logged off at 7.30 p.m.?) From the second graph, you
can tell that 6–8 p.m. was when most TV was watched and 12–2 p.m. the least.
Again, you will want to think about the early morning viewing recorded by Zoë on
Wednesday. (The most likely explanation for this is that she forgot to log off her
people meter.)
b. Answers will vary. For example, you can’t tell from the graphs who was watching TV at a particular time on a particular day; you can’t tell what channel was being
watched; you can’t tell whether people were actually paying attention to what was
on the screen or even if they were in the room.
3. a. Comments will vary. Mum logs in over breakfast time during the week and again at news time. She sometimes watches TV with Dad later in the evening. Dad
sometimes watches TV in the middle of the day – perhaps when he is home
because of his shift-work hours. Zoë is logged on for the most hours (but see
comments in 2a about Wednesday); she watches TV at some stage every day.
There were 3 weekdays when Trent didn’t watch any TV (or if he did, he forgot to log on!). He seems to prefer watching TV when someone else is there. Nathan
watches TV every weekday during the 2–4 p.m. slot and most days in the 4–6 p.m.
slot. He watches TV early in the morning in the weekend.
b. According to the logged hours, Zoë watches the most and Dad the least. (If
you don’t count Zoë’s Wednesday hours after 7.30 p.m., would she still watch the
most?)
c. As it was a Saturday night, the guest may have been a babysitter, who logged off
when Mum and Dad came home about 12.30 a.m. Alternatively, if the guest was
a child (or teenager) watching TV with Zoë and Trent (who both logged off at 10
p.m.), it may be that the guest forgot to log off and Mum or Dad may have come into
the room and turned the TV off between 12.30 and 1.00 a.m.
4. It’s odd that Zoë apparently watched TV all night on Wednesday night (see the answer for question 2a). (The guest watching alone on Saturday night isn’t odd if that person was babysitting.)
5. Answers will vary, but you need to refer back to the information given about the family. Apart from Zoë’s Wednesday night, there is nothing that stands out as necessarily unusual in the data (as would, for example, Zoë or Trent being
logged on during the school day).
6. a. The data doesn’t match Mum’s comment because Mum is logged on more than most of the others. Perhaps Mum logs on at 7 a.m. for a news broadcast, gets busy doing other things (in the same room or in different rooms), and then logs off about
8.30 a.m. She might log on at 6 p.m. for the news and then go backwards and
forwards to the kitchen while preparing a meal, before logging off at 7 p.m. (Or if
there is a TV in the kitchen, Mum may be logged on but not feel as if she is watching
it.)
b. If Mum’s comment is true, then her data isn’t of much value to the data collection
company.
Activity Two
1. Discussion will vary. Data such as this is collected by a market research company on behalf of television channels. It is used to generate ratings information and audience numbers and probably also to encourage advertising. TV channels use the ages of the viewers to establish the demographics of the people who watch their shows.
2. Data for 1 week (or even for 1 year) for 1 family is not enough to make a statement about the population, even more so when it seems that some of the data does not tell the full story. You would need to collect data over a period of
time and from many families to get an accurate picture of the viewing habits of people of different ages.
3. Answers will vary, but possible questions to investigate include:
• At what times of the day do the different members of a family (such as the Wades)
typically watch TV? (This is a variation of the question in Activity One, question 3a.)
• When would be the best time to advertise to target different audiences such as
children, home-based adults, workers? Decisions about extra data required will vary.
Key Competencies
People Meters can be used to develop these key competencies:
• thinking: interpreting, exploring, and using patterns and relationships in data
• using language, symbols, and texts: communicating fi ndings, using visual representations such as graphs and diagrams, demonstrating statistical literacy, using ICT as appropriate
• relating to others: working in groups, collaborating.