This is a level 5 algebra strand activity from the Figure It Out series.
A PDF of the student activity is included.
Click on the image to enlarge it. Click again to close. Download PDF (119 KB)
use a graph to find a pattern for a non linear relationship
FIO, Level 4+, Algebra, Book Four, From One to Another, page 16
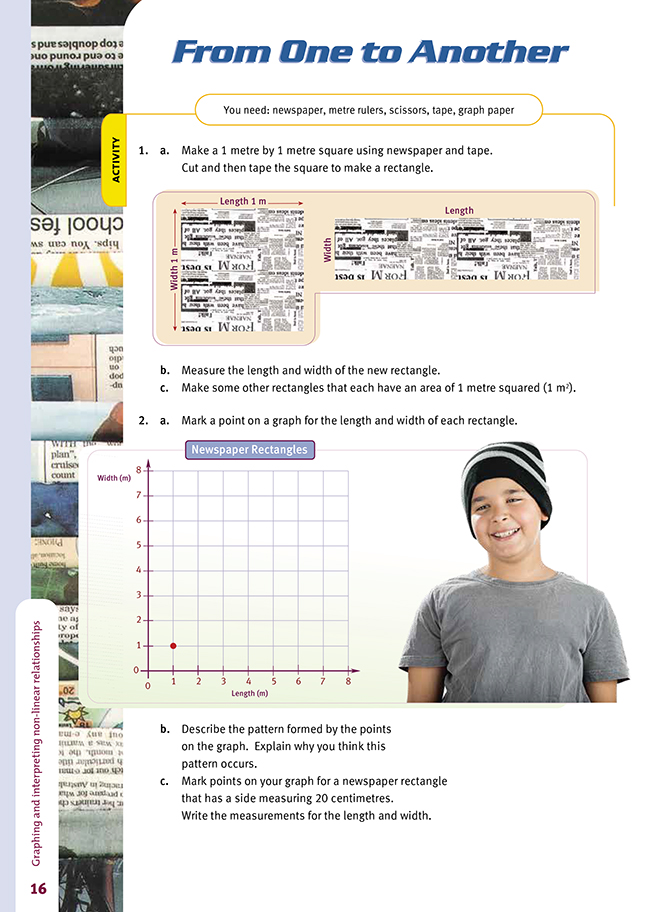
newspaper, scissors, tape
graph paper, metre rulers
In this activity, the students first use newspaper to make a square measuring 1 metre by 1 metre. It is important that the students make reasonably accurate measurements (for instance, to the nearest centimetre) and that they are comfortable in making conversions between units. For example, they will need to convert measurements in centimetres or millimetres to their equivalents in metres in order to plot them on the graph. They also need to check that each of their rectangles uses all of the newspaper in the square that they first make. This will ensure that the square and each rectangle has an area of 1 square metre (1 m2).
The students may have some difficulty plotting points representing the measurements of their rectangles. The scale on any graph they make is unlikely to accommodate measurements to the nearest millimetre or even centimetre. Unless they use a computer to draw the graph, the best they are likely to achieve is a scale showing measurements to the nearest 10 centimetres. This is enough to show the shape of the curve and to appreciate what is happening mathematically.
The graph in the Answers for 2a shows the points representing the dimensions for several rectangles. In fact, any point on this curve represents the dimensions of a rectangle with an area of 1 square metre.
The point (1,1) represents the square measuring 1 metre by 1 metre. In order to clearly see the pattern made by the points, the students will need to join the points with a smooth curve. (It’s often best to use a pencil for this.) The curve is known as a hyperbola. Notice that it gets closer and closer to the two axes but never touches them. Any rectangle they make has a finite area because there is always a (non-zero) length and width.
Note that it is possible to have either of two points to represent a rectangle that has the dimensions 20 centimetres (or 0.2 metres) and 5 metres. One point is C (0.2,5), and the other is D (5,0.2). The first co-ordinate given is, by convention, the dimension for the horizontal axis (in this case, length) and the second is for the vertical axis (width).
Rectangle measurements that are represented by identified points on the hyperbola are shown in the following table:
Notice that measurements for length and width are rounded to the nearest centimetre (hundredths of a metre). For example, a measurement of 25 centimetres is represented in the table above as 0.25 metres.
The rule for the pattern is 1 = x x y, which is usually written as 1 = x y or x y = 1. It can also be written as y = 1/x or even x = 1/y. The students might like to see if they can calculate how wide a rectangle with an area of 1 m2 would be if its length were 1 kilometre. Using the relationships described, a rectangle with an area of 1 m2 and length x = 1 kilometre (1 000 metres) will have width y = , or 0.001 metres. So the width of this rectangle is 0.001 metres = 1 millimetre.
Amswers to activity
1. a. Practical activity
b. Answers may vary. The most likely rectangle will be 2.0 m by 0.5 m.
c. Practical activity
2. a. A possible graph is:
b. Explanations will vary. The points form the path of a hyperbola. (A hyperbola is a curve that gets closer to each axis as the numbers along the axes get larger.) As the length increases, the width decreases (and vice versa). The area remains 1 square metre whatever the rectangle. So the width of a rectangle can never be zero, although it can be almost zero. As the width gets close to zero, the length becomes very large.
c. Two answers are possible. Point C on the graph represents a rectangle with length 20 cm and width 5 m. Point D represents a rectangle with length 5 m and width 20 cm.