In this unit students experience "randomness" through a related set of activities that link large sequences of tossing coins, random walks, Pascal's Triangle, and probabilities. All of these are a little too complicated for probability trees.
- Conduct straightforward experiments with coins, dice, spinners, and other random event generators.
- Produce and understand the concept of a random walk.
- Develop, understand, and apply Pascal's Triangle.
- Determine probabilities of a class that is a little too complicated for probability trees.
Many people in the general population have poorly developed intuitions of randomness. For instance, some people believe that there must be a cause behind certain events that, from a mathematical point of view, are deemed to be independent, random events. To develop a mathematical intuition in this area, students usually need to experience the process of randomness first hand. Although this initially requires patience, it does lead to important learning.
The aim of this unit is to provide experiences that will help students develop a better understanding of random processes. We first meet random processes by looking at tossing coins. Somewhat surprisingly, in a random series of tosses, large strings of Heads or Tails can occur. This is perhaps counter-intuitive to what might be expected. This is followed by experiencing random walks on both square and triangular grids. Work on grids of the latter type leads to the introduction of Pascal's Triangle. The aim of introducing this is to give students access to certain probability problems.
The learning opportunities in this unit can be differentiated by providing or removing support to students, and by varying the task requirements. Ways to support students include:
- modelling and assisting in the construction of diagrams
- providing extended opportunities for students to explore problems related to those presented in the unit
- providing opportunities for students to work in a range of flexible and strategically-organised groupings to encourage peer learning, scaffolding, and extension
- constructing a class chart of key ideas, models, and expressions to be used by students as a point of reference
This unit is focussed on exploring randomness in mathematical contexts, and as such, is not set in a real world context. You may wish to explore real world applications of randomness in teaching sessions following the unit, for example, in video game programming, lottery winnings.
Te reo Māori kupu such as matapōkere (random) and tūponotanga (probability, chance) could be introduced in this unit and used throughout other mathematical learning.
Session 1
In this session we look at a large number of tosses of a coin. The main conclusion is that there are more strings of Heads or Tails than students might expect.
Teaching Sequence:
- Give each student a 10x10 grid (Copymaster 1).

- Tell the students: Imagine that you toss a coin 100 times. Write down the results that you think are typical for such an experiment using an H (for Heads) in the first square, a T in the next, a T in the next, and so on.
- Swap your grid with your neighbour. Analyse the response. How many times did a string of 3 Heads or Tails occur? A string of 4? A string of 5? A string of 6? A string of 7?
- Let the students work in pairs. Give each pair another 10x10 grid. Ask one student to toss a coin 100 times. The other enters the results on the grid. They analyse the results together and compare with their earlier estimation.
- Class discussion. How good was your original estimation? What surprised you? What lessons are to be learned? Note: typically students vastly underestimate the likelihood of a string of 4 Heads or 4 Tails, and so on, and are surprised that in reality these occur more often than they predicted.
- Give each pair of students a computer generated list of 500 randomly generated Heads and Tails (see below and Copymaster 2). Analyse this list in the way they did the 100 tosses earlier.
H T T T T H H H T T T T H T T T T T T T T H H H T
T H H T T T T T H H H H H H T T H T T H T T T H H
H T H H T T T T H T H H H T H H H T T H H H H T T
T T T T H T T T T H H H H H T H T T T T T H T H T
T T H H H H T H T H H T H T H H T H H H H H T T T
H T H T H T H T H T H T H H H T H H T H T H T H T
H H H H T H T H H T T T H H H T T H T H H T T T H
H H T T H H H H T H T H T H T H T H T T T T H T H
H H H T H H T T H H T H H T H H T T H H H H H T T
T T H T H T T T H H T H H T H H T T T T T H H H H
H T T T T T H T H T H H H H T T T H H H H H H T T
T T T H T H H T H H H T T T H H H H H H T H T H H
H H T H T H H H H H T T T T T T T H H H H H H T T
H H T H H T H H H T H H H T H H T H H T H T T T H
H H H H H T H H H T H H H H H H T T T T T H T H T
T T T T T H T T H H H T H H H T H T T T H T T T H
H H T T H T H H H T T T T T H H H T H H T H T H T
T H H H H T H H H T T T T T H T T H H H H T T H H
T T T T T H T H H H T T T H H H H H T T H T T T T
H H H H H T T H T T H H H H T H T H H H T T T T T
Session 2
Here we look at random walks on square and triangular grids.
Teachers’ Notes
A random walk is a path traced out by a walker who next step is taken randomly. We look at random walks on the rectangular (Cartesian) grid and on a triangular grid. In the former case we use the tosses of two coins to determine the randomness. In the latter case we use spinners.
Generally each direction of a random walk is equally likely but for demonstration purposes on the rectangular grid we have chosen to (i) alternate a vertical and a horizontal movement and (ii) sometimes allow different probabilities in each direction.
In this session students will be generating random walks using two coins and printed grids. To do this it might be useful to have students work in groups of threes. One can toss the 10c coin, one the 20c coin, and the third can record the results and so produce the random walk.
Throughout this Teaching Sequence we have used coins and spinners. If these are not readily available for you, then dice or some other object(s) will do, provided the probabilities are retained.
Teaching Sequence
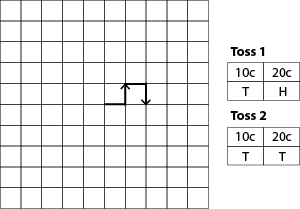
- Put the students into groups of three. Each group needs a grid (see Copymaster 3) and a pair of coins (a 10 cent and a 20 cent). Start a random walk in the middle of the grid. A Head on the 10 cent coin sends you one step to the left. A Tail on this coin sends you one step to the right. A Head on the 20 cent coin sends you one step up. A Tail on the 20 cent coin sends you one step down. Working in 3s, the pair of coins are tossed and the 2 steps – first in the horizontal direction and then in the vertical direction – are taken. Repeat many times and see where the random walk takes you. See diagram.
- Start at the beginning again and repeat.
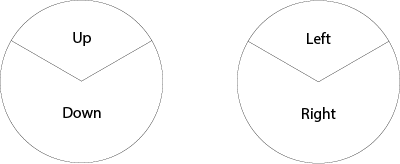
- Repeat with the two spinners below.
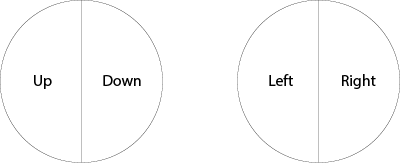
- Repeat with the two spinners below.
- Repeat with the two spinners below.
- Now do a different sort of random walk: down the pathway shown in the diagram.
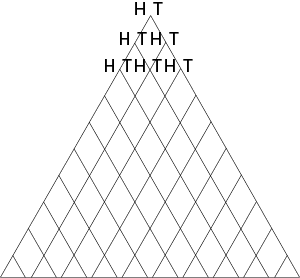
- Give each group a triangular grid - Copymaster 4. (This set of walks can be done in groups of two.) Get one student to toss a coin. If it is Heads, then the student doing the drawing marks in a step down the left side; if it is Tails, then the student doing the drawing marks in a step down the right side. Let the groups do several random walks from the top and note where they end up each time.
- After they have made several walks on the triangular grid, get the class together to discuss the results. There is an important result that students need to find out. Hopefully they will find this out for themselves. To support students' thinking, ask them: Where do you end up if you get 4 Heads followed by 3 Tails? Now change the order but ensure that there are still 4 Heads and 3 Tails. Where do you end up? Repeat as many times as you need to underline the fact that you always end up at the same point.
- Repeat for 3 Heads and 5 Tails. Ensure that students fully grasp this fact. To assist, ask them to explain why you always end up at the same point.
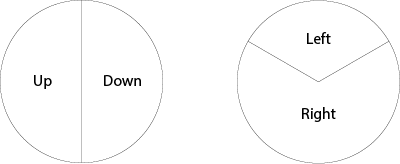
- Now on the same triangular grid, do a random walk with a skewed probability of 0.25 and 0.75. Use a spinner. That is, 25% of the time go left, 75% of the time go right.
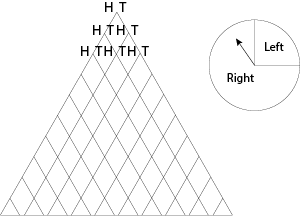
- Do several random walks. Again press home the point that 4 Lefts and 6 Rights will always end at the same point regardless of the order.
Session 3
In this session we look at the number of ways of getting to any particular point in a triangular grid. This produces Pascal’s Triangle. We discuss some interesting facts about that triangle.
Teachers’ Notes
A. Pascal’s Triangle is the array of numbers shown below.
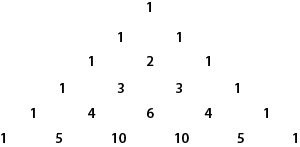
The numbers down the side are all ones and the other numbers are found by adding together the two numbers above it to the left and right. The entries in any row are actually the coefficients of the expansion of (x + 1)n, where n is one less than the number of the row.
It is worth noting that the sum of the numbers on each row of the triangle is a power of 2. The power is one less than the number of the row from the top. There is also a pattern called the Hockey Stick pattern. Add all the numbers in the first few terms of a diagonal starting from a 1. The answer is on the row below the last number. The added numbers and the sum form a hockey stick shape.
Teaching Sequence
- Give students the same triangular grid that was used in the latter half of the previous session. Problem: How many routes are there from the top to the point marked A?
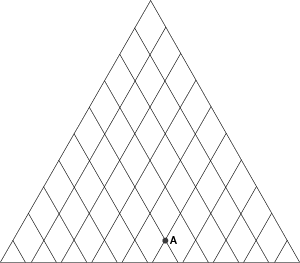
- Students, typically will try to draw each route using different coloured pens. It turns out to be practically impossible to keep track. Let them struggle. Eventually encourage them to find a different strategy. They need to solve a simpler problem first and look for a pattern. See diagram below.
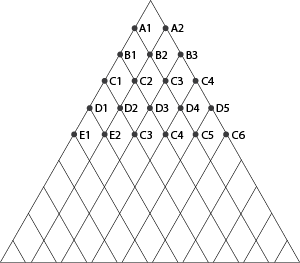
- The simplest problem is, How many routes to A1? Answer: 1. How many to A2? Answer: 1. How many routes to B1? Answer: 1. How many to B2? 2. How many to B3? 1. How many to C1 etc? See diagram below.
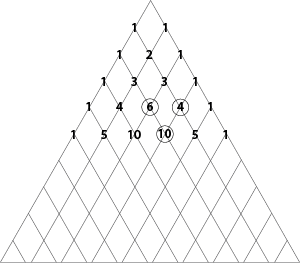
- Can you see a pattern? Add the previous 2 numbers to get the next. Example, add 6 + 4 to get 10. Engage in a class discussion. Why does this rule of adding always work?
This pattern of numbers is called Pascal’s Triangle.
- Extend the triangle 4 or 5 more levels. Keep a copy ready at hand, it will prove useful in other situations.
- Investigate this triangle in groups. For example, add the numbers in each horizontal row. Can you see a pattern? (2 to the row number less one.) How abut sums of diagonal numbers? (The Hockey Stick result.)
Session 4
Here we use Pascal’s Triangle to solve probability problems. The probability questions are on Copymaster 5 and the answers are at the end of the teaching sequence
Teachers’ Notes
A. This session contains more material than can be covered comfortably in one lesson.
Teaching Sequence
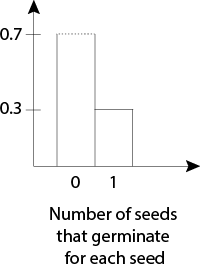
- Go through an example with the class. 6 pine tree seedlings are planted. Each has probability 0.3 of germinating. Find the probability that exactly 2 will germinate.
- Six such distributions need to be added. But the tree diagram quickly becomes complicated with its many branches.
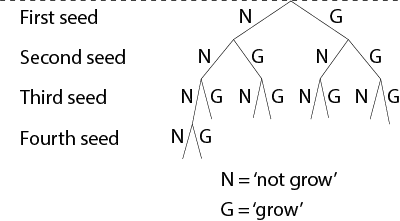
- What is needed, in fact, is not the whole tree, but only those branches that contain 2 Gs and 4 Ns to retain the 0.3 G and 0.7 N probability. For example:
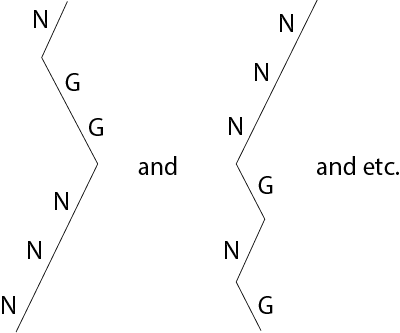
- But we know, from a previous session, that 2 Gs and 4 Ns on triangle of random walks will always end at the same place. And we know, using Pascal’s Triangle, that there are 15 different routes that contain 2 Gs and 4 Ns. That is, there are 15 different combinations of 2 Gs and 4 Ns (NNNNGG, NNNGNG, NNNGGN, etc). If there is any doubt about this it does not take long to list all 15 combinations provided one does it systematically. Every one of these has the same probability of occurring (why?): (0.7)4 x (0.3)2. So the probability of exactly 2 trees germinating is 15 x (0.7)4 x (0.3)2 = 0.32 (2dp).
- For the remainder of the session, have students work through the word problems in Copymaster 5.
Solutions to the questions on Copymaster 5 (all given to 2dp).
Probability of 0 seedlings = 1 x (0.7)6 = 0.12
Probability of 1 seedlings = 6 x (0.7)5 x (0.3) = 0.30
Probability of 2 seedlings = 15 x (0.7)4 x (0.3)2 = 0.32
Probability of 3 seedlings = 20 x (0.7)3 x (0.3)3 = 0.19
Probability of 4 seedlings = 15 x (0.7)2 x (0.3)4 = 0.06
Probability of 5 seedlings = 6 x (0.7)x (0.3)5 = 0.01
Probability of 6 seedlings = 1 x (0.3)6 = 0.00
Probability of two 50s = 10 x (0.4)2 x (0.6)3 = 0.35
Probability of 3 defective = 120 x (0.1)3 x (0.9)7 = 0.06
Probability of 5 sixes = 126 x (1/6)5 x (5/6)4 = 0.02
Proportion of families = 70 x (0.5)4 x (0.5)4 = 0.27
Probability of 7 heads = (0.5)7 = 0.01
Find the probability for each number of defective switches and find the sum of (each probability x corresponding number of switches) So, probability of 1 defective switch x 1 + probability of 2 defective switches x 2 + probability of 3 defective switches x 3 + …
Dear families and whānau,
Recently we have been exploring "randomness" through sequences of tossing coins, random walks, Pascal's Triangle, and probabilities. Ask your child to share their learning with you.