This is a level 2 statistics activity from the Figure It Out series.
A PDF of the student activity is included.
Click on the image to enlarge it. Click again to close. Download PDF (2501 KB)
answer questions from graphs
collect and sort data
construct a dot plot
discuss findings
This diagram shows the areas of Statistics involved in this activity.
The bottom half of the diagram represents the 5 stages of the PPDAC (Problem, Plan, Data, Analysis, Conclusion) statistics investigation cycle.
A tape measure or metre rulerer ruler
FIO, Levels 2-3, Statistics Revised Edition, Greater Heights, pages 4-6
Classmates
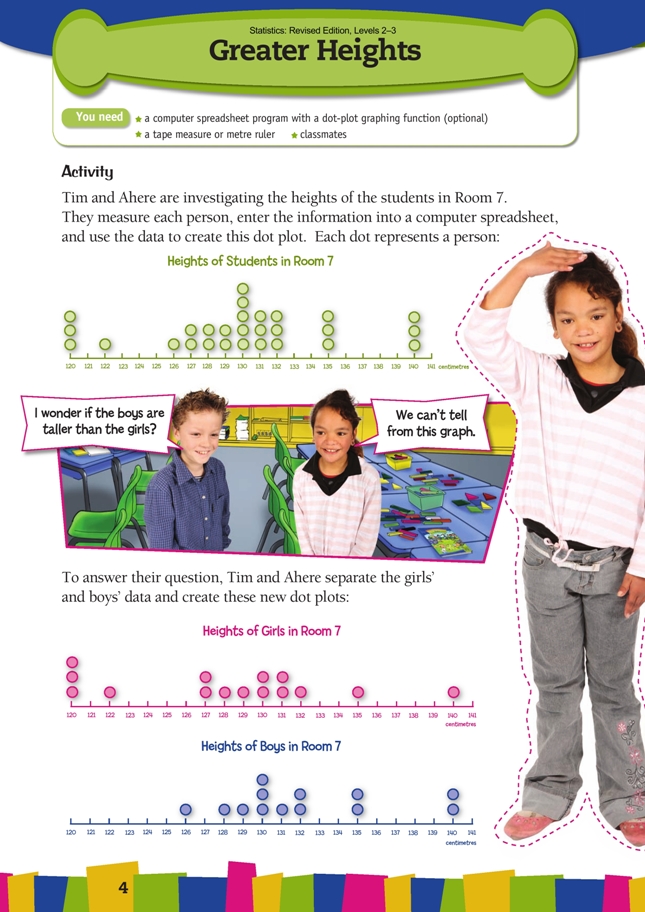
This activity introduces the students to dot plots and – most importantly – to the fact that data can be summarised to the extent that important details become invisible and stories lost.
Unlike the first dot plot, which graphs only one variable (height), the second and third dot plots graph two variables (gender and height). By comparing these latter two graphs, students are able to fi nd points of similarity and difference and, potentially, answer a range of “I wonder” questions.
For question 1, the Answers suggest some comparative statements. The students should have to justify their statements from the data. They could do this in small groups, followed by a report back. Particularly as they are learning how to conduct and resolve a mathematical or statistical
argument, they need you to be involved.
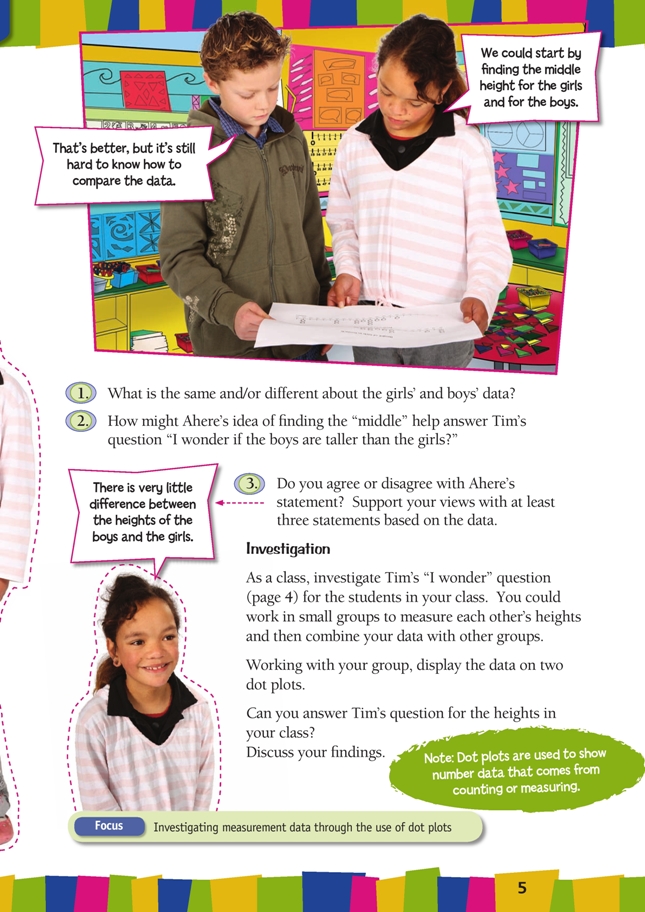
Question 2 involves fi nding the “middle” or median. (The median is the number that comes in the middle of a set of numbers when they are arranged in order. Where two or more data sets are involved, it can be very useful to compare medians as part of the data exploration process.)
Question 3 challenges the students to think about whether the differences that they have found between the two data sets are actually signifi cant and then to support their view.
Investigation
Use this investigation to reinforce the PPDAC cycle. It is of crucial importance that students are not just going through the motions of an investigation. The idea is that statistical investigation should acquire a specifi c shape in students’ minds and that, over time, they come to rely less and less on teacher-provided scaffolding.
The PPDAC cycle makes it clear that graphing is not an end in itself but a means to an end. Graphs have an analytical purpose: they help the user fi nd patterns and key features in a data set. They also have a communications purpose: they enable the user to explain, justify, and persuade. Students need to learn how to dig below the surface to uncover and tell the story or stories embedded within a graph. It is very important, therefore, that students don’t get lost in technicalities and rules about what graphs must look like or have. The conventions are less important than the purposes.
Of all the graphs available, the linear dot plot is probably the easiest for a student to create (although not available in all graphing programs). One can be created as a communal exercise if each student is given a self-adhesive dot to represent themselves (in this case, their height), which they bring up to the front and stick on an appropriately labelled section of number line. By doing this, the link between themselves, the data, and the graph is emphatically made.
Answers to Activity
1. Comments may vary. Possible comparisons that you might make are:
• Most of the students in the class, both girls and boys, are between 127 cm and
132 cm tall.
• The tallest girl and the two tallest boys in Room 7 are all 140 cm tall.
• There are no boys shorter than 126 cm, but there are 4 girls shorter than this.
• There are twice as many taller boys than girls, if you defi ne “taller” as “more than
132 cm”.
• No matter where you make the cut-off point, there are more shorter girls than
boys.
• There are more girls (15) than boys (13) in Room 7 (at least, there were on the day
that the measuring took place).
2. The median (middle) girl is 129 cm tall and the median boy is 131 cm tall. Five out
of the 15 girls and 7 out of the 13 boys are as tall or taller than 131 cm. Using this
comparison, it could be said that the boys are taller than the girls.
3. Opinions and statements will vary. Some of the answers to question 1 could be used to argue against Ahere’s view. Arguments that would support her view include:
• The tallest girl is the same height as the tallest boy.
• The girls’ median height is only 2 cm less than the boys’.
• If you ignore the group of 4 girls who happen to be significantly shorter, the
girls’ data looks very similar to the boys’ data.
• If there were equal numbers of boys and girls, the two groups might look even
more similar [but then again, they might look even more different!].
Investigation
Investigations and dot plots will vary.
Key Competencies
Greater Heights can be used to develop these key competencies:
- using language, symbols, and texts
- relating to others.