This is a level 4 statistics activity from the Figure It Out series.
A PDF of the student activity is included.
Click on the image to enlarge it. Click again to close. Download PDF (720 KB)
list all possible outcomes
All students should be able to attempt this activity, especially if they work in pairs. The instructions are brief and use no technical words. For a bit of drama, you may like to introduce it from the front of the classroom, using actual bowls and beans.
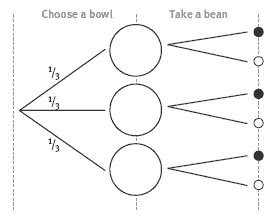
By now, students will have had practice with tree diagrams, but they may have trouble working out how to use a tree in this rather different context. The key is for them to recognise that, once they have sorted the beans into bowls, they have two choices (first the bowl, then a bean), so they will need a tree that has 2 sets
of branches. The basic shape will be like this:
Question 3b involves both the multiplication and addition of fractions and moves the problem on to a different level of understanding and skill.
Another game show problem worth exploring is the “Monty Hall paradox”, which asks whether contestants can improve their chances of winning a game show by changing their choice at the last moment. This problem caused major arguments among mathematicians when it was first discussed, along with some very red faces.
An Internet-based research project could be set, with students acting out the game show and explaining what they have discovered. Simulations for the problem are also available. Students could begin by typing Monty Hall into an Internet search engine. There are a number of good sites to choose from, including some that are accessible for an interested student.
Answers to Activity
1. There is the same number of yellow beans as red ones.
2. Answers will vary. Two possibilities are 2Y 2R, 2Y, 2R, 2Y 2R and 1Y 3R, 1Y 2R, 4Y 1R.
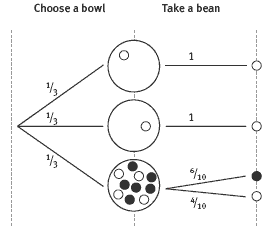
3. a. 1Y, 1Y, 4Y 6R
b. With the beans arranged in this way, Liang is certain to get a bowl with a yellow bean in it. If she chooses bowl A or B, she will get a yellow bean (because there is no other possibility). If she chooses bowl C, she has 4 chances in 10 of
getting a yellow bean, so overall, her chances are 80%: 1/3 + 1/3 + (1/3 x 4/10 )
or 5/15 + 5/15 + 2/15 = 12/15, which is 4/5 or 80%.
Your tree diagram could look like this: