This is a level 3 statistics activity from the Figure It Out theme series.
A PDF of the student activity is included.
Click on the image to enlarge it. Click again to close. Download PDF (1820 KB)
interpret graphs
A classmate
If the students are able to read and interpret the relationships between the x axis (horizontal line) and the y axis (vertical line), they will be able to make sense of the situations represented by these graphs.
Questions 1 and 2 deal with the highest and lowest points of the graph, which need to be located and explained. You could discuss other features of the graph to help the students make sense of it.
For example:
• “What has happened between 9 a.m. and 10 a.m.?”
• “Explain the sudden increase in people from 11.30 a.m. to 12 noon.”
• “How many people left the stall between 1 p.m. and 1.30 p.m.?”
• “How many staff would be needed at 3 p.m.?”
The students can be as creative as they like when they write a story for question 3, but they must make sure that everything they say is represented on the graph and that their story explains all the changes on the graph. Their classmate can then assess the story for relevance and any inaccuracies. If they wish, they can tell more than one story about the graph.
Small groups could then each prepare a story to share with the class as an oral presentation. You could conclude this experience by listing with the class the important aspects to consider when reading a graph. The points you list may include:
• Read the title and axis labels to see what the graph is about.
• Read the axis labels carefully to find out what relationship is described.
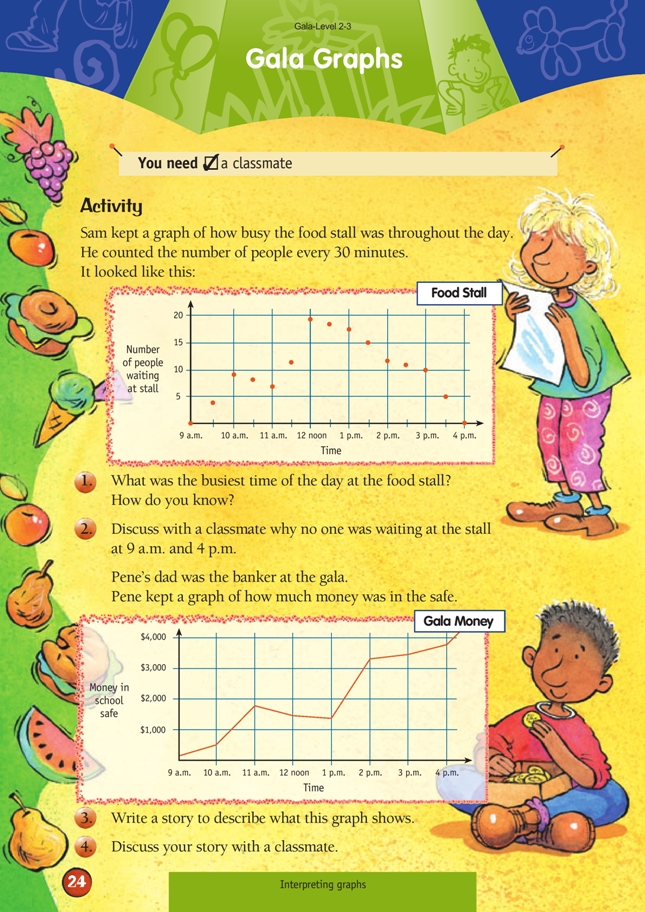
• Look carefully at the points shown on the graph, for example, at 12 noon, there were 19 people waiting at the food stall.
• Note the high points and low points and explain these.
• Divide the graph into parts or sections and explain what is happening in each part.
• Look for important trends indicated by the graphs.
• Note whether the slope on the line of Pene’s graph is gentle or steep.
• Calculate the difference between the highest and lowest values.
• Consider the overall effect of the scale of the graph, that is, the vertical and horizontal spacing of axis labels, because this can affect the appearance of the graph and may exaggerate some aspects.
You can extend or follow up this activity by:
• making up a story for another gala stall, which the students then graph, or the students could make up their own stories and graph them
• asking the students to draw a bar graph from the information on the line graph, as an alternative model
• asking the students how they could use the graphs to help plan for next year’s gala.
Answers to Activity
1. 12 noon – because the highest point in the graph is at 12 noon, when 19 people were waiting
2. Discussion points could include that the gala started at 9 a.m., so no one had got to the stall. At 4 p.m., the stall might have run out of food or the gala might have ended.
3. Answers will vary. An example is: the bank started with a $100 float. The stalls started to make money, and people deposited the money in the bank from 9 a.m. Between 11 a.m. and 1 p.m., stallholders got change from the bank and paid out some prizes, and they didn’t have time to deposit any money. Between 1 p.m.
and 2 p.m., the stalls deposited their money from the lunch rush. The last increase was after 4 p.m., when stallholders deposited their last takings.
4. Answers will vary.