This is a level 2 statistics activity from the Figure It Out theme series.
A PDF of the student activity is included.
Click on the image to enlarge it. Click again to close. Download PDF (481 KB)
create graphs for a given data set
answer questions based on the graphs
A ruler
Graph paper
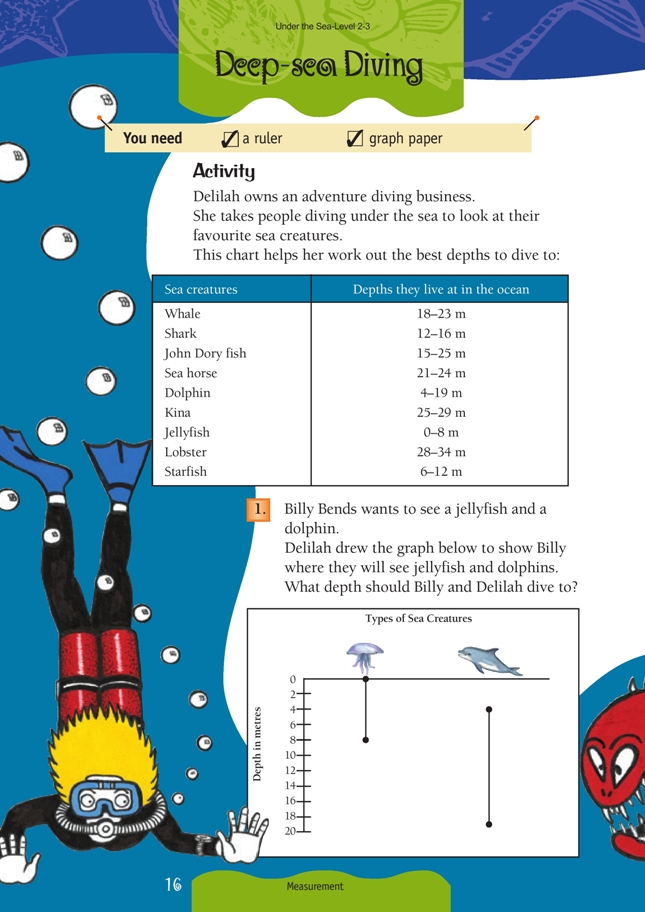
Graphs are an excellent visual solution to the diving depth problem. They depict the relationship between the creature and its favoured living depth.
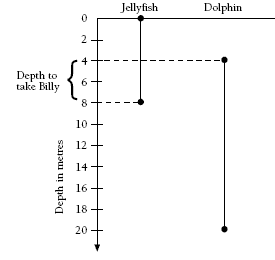
In the case of Billy Bends, the depth which Delilah should go to is the depth that is common to the two creatures:
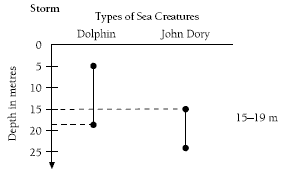
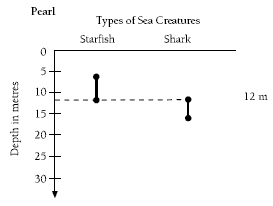
To draw suitable graphs for each sea creature, students will first need to decide on the vertical scale. This is determined by the greatest depth one of the creatures is found at. The graphs for each customer are shown in the answers.
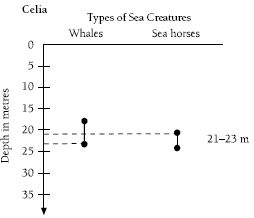
To find the solution to question 3, students may draw a graph for all the sea creatures or scan the table for depth ranges that include 22 metres. This means that the creatures that are likely to be seen at that depth will be whales, John Dory fish, and sea horses.
Answers to Activity
1. Between 4 m and 8 m (common to both sea creatures)
2.
.gif)