Students explore the relationship between sample space and likelihood of outcomes, using area-based random generators in the form of spinners. The rapid generation of data in dynamic tables and graphs introduces students to the notion of long-run data being more reliable than short-run data.
The Mystery spinner series complements and extends the Spinner series of learning objects.
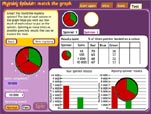
Students are presented with a frequency graph, compiled following the testing of an unseen 'mystery' spinner. They work out the likely number of sectors and proportions of colours in the mystery spinner and create a spinner they think matches it. Students test their spinner and compare it to the graph generated by the mystery spinner.
Mystery spinner: challenge
Students create a spinner with up to five equal-sized sectors and fill the sectors with up to five colours to match the frequency graph.