Quartiles

The Ministry is migrating nzmaths content to Tāhurangi.           
Relevant and up-to-date teaching resources are being moved to Tāhūrangi (tahurangi.education.govt.nz). 
When all identified resources have been successfully moved, this website will close. We expect this to be in June 2024. 
e-ako maths, e-ako Pāngarau, and e-ako PLD 360 will continue to be available. 

For more information visit https://tahurangi.education.govt.nz/updates-to-nzmaths
Numbers separating an ordered distribution into four groups, each containing (as closely as possible) equal numbers of values. The most common names for these three numbers, in order from lowest to highest, are lower quartile, median and upper quartile.

The lower quartile is a number that is a quarter of the way through the ordered distribution, from the lower end. The upper quartile is a number that is a quarter of the way through the ordered distribution, from the upper end.

There are several different methods for calculating quartiles. For reasonably small data sets it is recommended that the values are sorted into order (or displayed on a suitable graph) and then the median is calculated. This allows the distribution to be split into a ‘lower half’ and an ‘upper half’. The lower quartile is the median of the ‘lower half’ and the upper quartile is the median of the ‘upper half’. Use software for large data sets.

Note that different software may use different methods for calculating quartiles that may give different values for the quartiles. This is of no concern because in most cases any differences will be slight.

Example 1 (Odd number of values)

The maximum temperatures, in degrees Celsius (°C), in Rolleston for the first 9 days in November 2008 were: 18.6, 19.9, 20.6, 19.4, 17.8, 18.1, 17.8, 18.7, 19.6

Ordered values: 17.8, 17.8, 18.1, 18.6, 18.7, 19.4, 19.6, 19.9, 20.6

The median is 18.7°C.

The values in the ‘lower half’ are 17.8, 17.8, 18.1, 18.6. Their median is the mean of 17.8 and 18.1, which is 17.95. The lower quartile is 17.95°C.

The values in the ‘upper half’ are 19.4, 19.6, 19.9, 20.6. Their median is the mean of 19.6 and 19.9, which is 19.75. The upper quartile is 19.75°C.

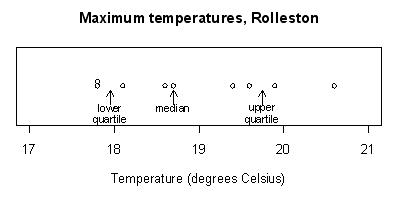
The data and the quartiles are displayed on the dot plot below.

Notice that there are 2 values below the lower quartile, 2 values between the lower quartile and the median, 2 values between the median and the upper quartile and 2 values above the upper quartile.
 
Example 2 (Even number of values)

The maximum temperatures, in degrees Celsius (°C), in Rolleston for the first 10 days in November 2008 were: 18.6, 19.9, 20.6, 19.4, 17.8, 18.1, 17.8, 18.7, 19.6, 18.8

Ordered values: 17.8, 17.8, 18.1, 18.6, 18.7, 18.8, 19.4, 19.6, 19.9, 20.6

The median is 18.75°C.

The values in the ‘lower half’ are 17.8, 17.8, 18.1, 18.6, 18.7. Their median is 18.1. The lower quartile is 18.1°C.

The values in the ‘upper half’ are 18.8, 19.4, 19.6, 19.9, 20.6. Their median is 19.6. The upper quartile is 19.6°C.

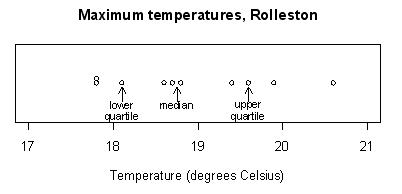
The data and the quartiles are displayed on the dot plot below.

Notice that there are 2 values below the lower quartile, 2 values between the lower quartile and the median, 2 values between the median and the upper quartile and 2 values above the upper quartile.

See: median

Curriculum achievement objectives references
Statistical investigation: Levels (5), (6), (7), (8)