This is a level 3 statistics activity from the Figure It Out series
A PDF of the student activity is included.
Click on the image to enlarge it. Click again to close. Download PDF (1727 KB)
construct a dot plot graph
describe the data
interpret statements made about the data
This diagram shows the areas of Statistics involved in this activity.
The bottom half of the diagram represents the 5 stages of the PPDAC (Problem, Plan, Data, Analysis, Conclusion) statistics investigation cycle.
FIO, Level 3, Statistics Revised Edition, Winning Dots, pages 12-13
Classmates
Another class
These activities involve the students in drawing and interpreting dot plots*. The students have to be able to find evidence within the dot plot to either support or refute various statements made about discrete data. They also carry out an activity that begins with a whole-class data-gathering exercise.
Activity One
This activity provides an ideal opportunity to discuss the difference between discrete and continuous data. In this case, the variable is distance (or length). Distance is not restricted to whole metres (for example, 14 or 15 metres); it can also be any distance in between (for example, 14.5 or 14.675 metres). For this reason, distance is a continuous variable. In this activity, however, the data has been recorded as if it were discrete. You could discuss with your students why and how this might have been done. As the event was a fun competition, not the Olympic Games, there was neither the need nor the ability to record throws to the nearest millimetre. The throw may have taken place on the netball court, with chalk lines marking out the metres. If a throw landed between the 14 and 15 metres mark, it would be recorded as 14
metres. In a situation like this, the “rounding up” convention would not normally be applied.
You will need to discuss the idea of clustering. A “cluster” is a group of data found together in a clump.
If your students have had prior experience with dot plots, you may want them to do this activity with minimal further guidance. If they are uncertain about how to interpret them, ask a few simple questions to get them started, for example:
• What was the most common distance thrown?
• What was the shortest distance thrown?
• What is the distance between the longest throw and the shortest throw?
When the students go on to make their own dot plots (first in question 2), remind them to record one dot for each piece of data.
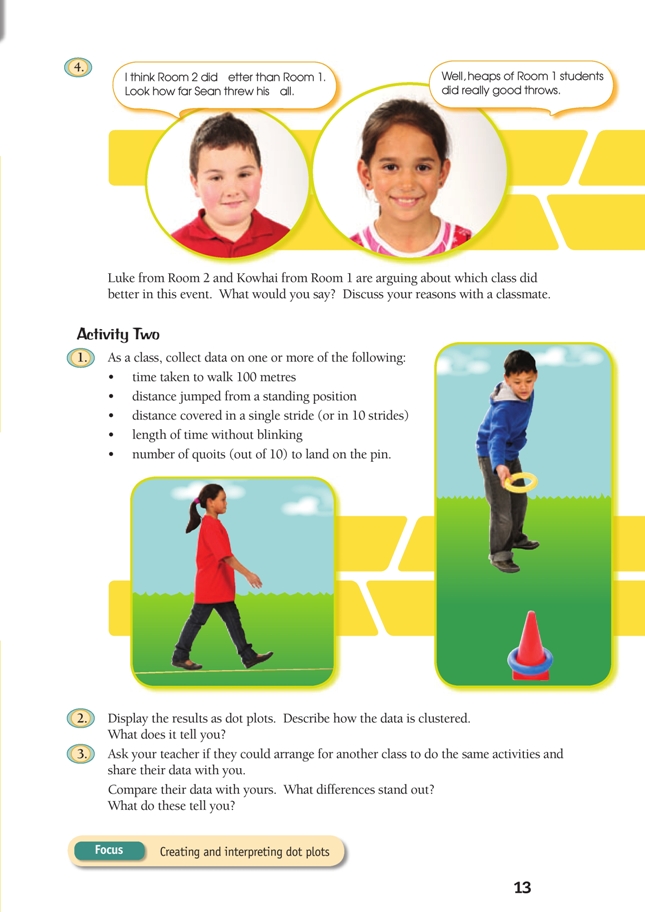
Activity Two
This whole-class activity will require direction from you. The class need to determine what data they are going to collect, and they need an understanding of the PPDAC cycle. The amount of scaffolding required will depend on the ability levels of the students.
This task reinforces the idea of clustering. The range of results may lead to an interesting discussion about the importance of context when looking at patterns in data. Discuss what is meant by outliers so that the class are able to decide if values at the extremes are to be retained as legitimate or rejected on the grounds that they are the result of some accident or abnormality in the process.
Comparing their own class data with that of another class is a very valuable exercise. This is an appropriate time to discuss variation in data sets. It is a feature of all statistics data gathering that each different sample gives different results. Smaller samples tend to be more variable.
Larger samples tend to be more similar to each other.
Make sure that the students are aware that one of the big advantages of dot plots is that the distribution of the data is clearly evident. The “picture” can be lost when data is summarised in a table.
Answers to Activities
Activity One
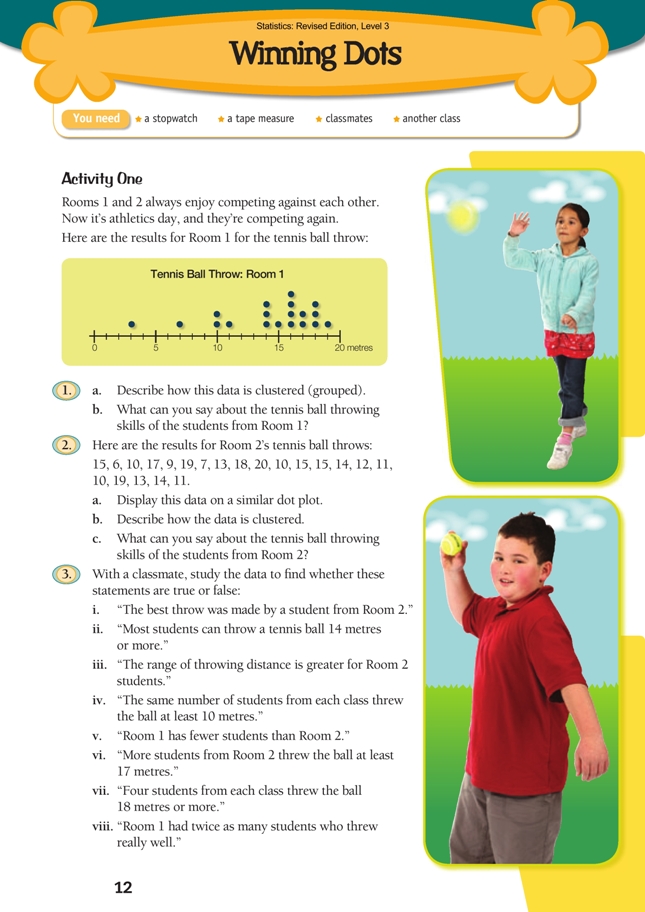
1. a. Descriptions will vary. There is a cluster of three students whose throws were 10 to 11 metres. The great majority of the students threw the ball 14 to 19 metres. This fact shows up on the dot plot as a big cluster. The 3 metre and 7 metre throws are short throws. The 7 metre throw may have been from someone who genuinely
couldn’t throw very far. It is unlikely that someone could manage to throw a tennis
ball only 3 metres, so this outlier may represent a mis-throw.
b. Most of the students in Room 1 can throw a reasonable distance. Only one or two
are what you could call poor throwers.
2a.
b. The main cluster is between 10 and 15 metres; a smaller cluster is between 17
and 20 metres. There are 2 short throws of 6 metres and 7 metres.
c. Fewer students in Room 2 are very good throwers, but Room 2’s best throw is a
metre further than Room 1’s best throw.
3. i. True. The best throw is 20 metres, from Room 2.
ii. Although most Room 1 students (14 out of 19) threw 14 metres or more, fewer
than half of Room 2’s students (10 out of 21) did. Taking the two classes together,
24 out of 40 threw 14 metres or more. If by “most”, “more than half” is meant, then
the statement is true. If by “most”, “considerably more than half” is meant,
the statement is false.
iii. False. The range for Room 1 is 19 – 3 = 16 metres and for Room 2 is
20 – 6 = 14 metres.
iv. False. 17 students from Room 1 and 18 from Room 2 did throws of 10 metres
or more.
v. True. Room 1 has 19 students and Room 2 has 21.
vi. False. 6 students from Room 1 and 5 from Room 2 did throws of at least
17 metres.
vii. True
viii. It depends on your defi nition of throwing “really well”. If you defi ne it as 16 metres or more, the statement is true (Room 1: 10 throws; Room 2: 5 throws).
4. Reasons and discussion will vary. You will need to have considered longest throws, your definition of “really good throws”, and how the throws are clustered.
Activity Two
Data and findings will vary.
Key Competencies
Winning Dots can be used to develop these key competencies:
• thinking
• using language, symbols, and texts
• participating and contributing.