This is a level 4 statistics activity from the Figure It Out theme series.
A PDF of the student activity is included.
Click on the image to enlarge it. Click again to close. Download PDF (351 KB)
interpret information from a graph
find the speed from a time/distance graph
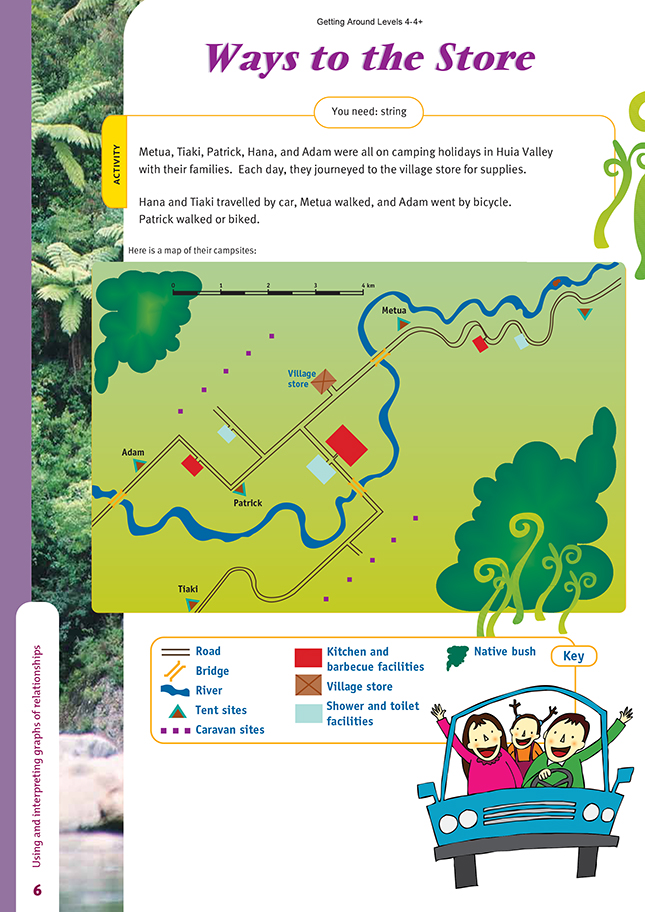
FIO, Levels 4-4+, Theme: Getting Around, Ways to the Store, pages 6-7
String
In this activity, the students need to take careful measurements off the scale map provided and link these to the points on the graph. They will be able to do this most easily using a narrow strip of thin card marked in centimetres (1 cm represents 0.5 km) or a piece of string or thin wire.
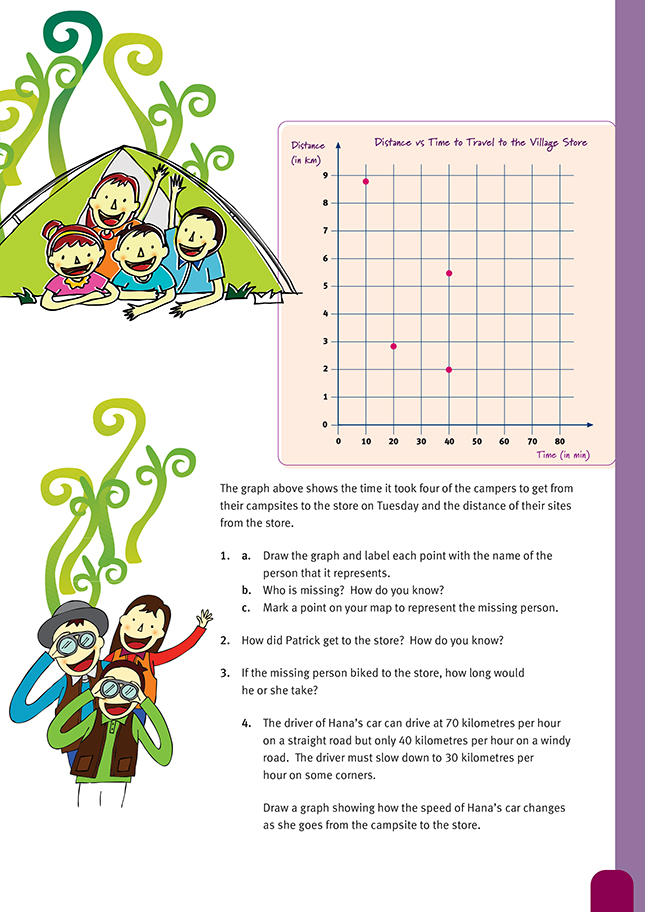
Once they have the distances of each person from the store, the students can identify which point on the graph belongs with which holidaymaker. They will find that there is no point to represent Hana, who is 7.5 kilometres from the store.
Patrick travels 3 kilometres in 20 minutes, which is 9 km/h. This is obviously far too slow to be car travel, and it would be extremely fast walking. A comparison with Adam, who is known to use a bike, shows that he travels about twice as far as Patrick in twice the time. This means their speeds are similar, which makes
it highly likely that Patrick also uses a bike for the trip.
Patrick covers 3 kilometres in 20 minutes on his bike, which is 1.5 kilometres in 10 minutes. Hana, who is the missing person, has 2.5 times as far to travel, so she could expect to take 2.5 times as long, which is 50 minutes. A graphical method of getting the same result would be to extend a line through the points representing the two known cyclists (Patrick and Adam) until it cuts the horizontal line representing 7.5
kilometres. The point where these two lines cut should be over the 50 minutes mark on the horizontal (time) scale.
Question 4 challenges the students to plot speed against distance. The horizontal axis of the graph needs to extend to 8 kilometres and the vertical axis to the maximum speed of 70 km/h. Using a strip of card or a piece of string, the students will need to mark the distances of each bend or corner measured from the camp store to Hana’s campsite. There are only three very sharp corners, each of which will be represented on the graph by a dip.
To get value out of the question, the students need to carefully plot the curve, not simply draw a wiggly line to indicate that the car is accelerating and decelerating as it goes around the curves. They may also like to consider whether the graph should slope away more steeply than it rises. This could lead to an interesting discussion of driving habits!
Answers to Activity
1a.
b. Hana. Her distance from the village store (7.5 km) is not accounted for on the graph. Her distance is 1 km less than that of Tiaki, who also travels by car, so she would probably travel at a similar speed and take about 9 minutes.
c. See the graph for 1a.
2. Patrick biked. Compared with Adam, his campsite is about half the distance from the store. Patrick took half the time that Adam took to get there from his site, so he travelled at the same speed as Adam and it is likely that he biked too.
3. Hana would take about 50 minutes by bike. (Patrick took 20 min to cycle 3 km. Hana has to cycle 2.5 times as far [2.5 x 3 = 7.5 km], so she is likely to take about 2.5 times as long: 2.5 x 20 = 50 min.)
4. Your graph should look something like this: