This is a level 4 algebra strand activity from the Figure It Out series.
A PDF of the student activity is included.
Click on the image to enlarge it. Click again to close. Download PDF (380 KB)
use tables or rules to describe a linear number pattern
toy money (optional)
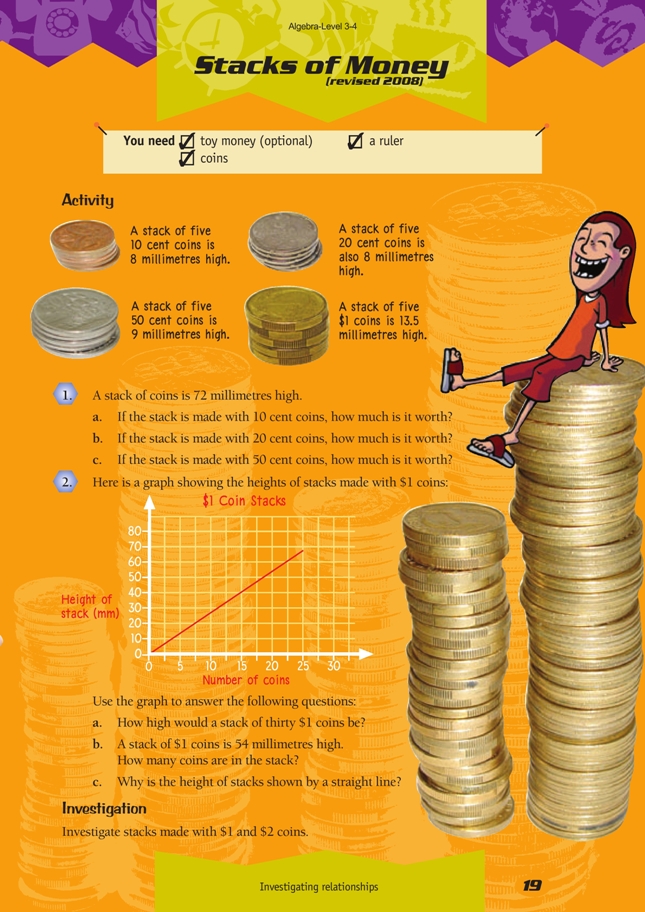
FIO, Level 3-4, Algebra, Stacks of Money, page 19
ruler
coins
This activity gives students further experience with linear relationships and the way changing one variable (the number of coins) will effect the other variable (the height of the stack).
To answer question 1,the students may find tables or double number lines useful.
For example, for 1a:
![]()
There are 45 coins in the stack. 45 x $0.10 = $4.50
1b:
There are 45 coins in the stack. 45 x $0.20 = $9.00
Alternatively, if the students use multiplication and division, they could answer 1c in this way:
ten 50 cent coins is 18 millimetres high.
How many 18s in the 72 millimetre stack? 72 ÷ 18 = 4
So the stack has 4 x 10 = 40 coins, and 40 coins each worth 50 cents is $20.
In question 2, the students extrapolate (work outside a data set) and interpolate (work within a data set) from a given graph.
For example, question 2a can be answered by extrapolation. The students will need to extend the line of the graph until it is above 30 on the x axis. Then they will draw a vertical line directly up from 30 on the x axis until it meets the line of the graph. They will draw a horizontal line from the point above 30 on the line of the graph across to the y axis. The point at which the line hits the y axis is the height of the stack. The students will need to work carefully to ensure that their vertical line is at right angles to the x axis and their horizontal line is at right angles to the y axis.
The students will work in a similar way to answer question 2b by interpolation. They will extend a horizontal line from the 54 millimetre point on the y axis until it meets the line of the graph. From this point on the line of the graph, they take a vertical line down to the x axis to find the number of coins.
The points on the graph lie on a straight line because the width of a coin is constant. As each extra coin is added to the stack, the height increases by a constant amount. The relationship between the number of coins and the height of the stack is linear.
Answers to Activity
1. a. $4.50
b. $9
c. $20
2. a. 81 mm
b. 20
c. Two possible answers are:
i. The line climbs evenly because the coins are shown on the horizontal
axis in groups of 5. This means that the relationship between the number
of coins and the height of the stack is constant or linear.
ii. For every extra coin that is added, the height of the stack increases by
the same amount (2.7 mm). This means that the relationship between
the number of coins and the height of the stack is constant or linear and the
graph of this relationship will be a straight line.
Investigation
$1 and $2 coins are both 2.7 mm thick. So stacks of the same height will be worth twice as much when made with $2 coins as they are when made with $1 coins.