This is a level 3 statistics activity from the Figure It Out series.
A PDF of the student activity is included.
Click on the image to enlarge it. Click again to close. Download PDF (2331 KB)
interpret information from a graph
create a graph
This diagram shows the areas of Statistics involved in this activity.
.gif)
The bottom half of the diagram represents the 5 stages of the PPDAC (Problem, Plan, Data, Analysis, Conclusion) statistics investigation cycle.
Statistical Ideas Snack Attack involves the following statistical ideas: interpreting stacked bar graphs, creating and interpreting scatter plots, analysing multivariate data sets, and making comparisons.
A computer spreadsheet/graphing program (if available)
FIO, Levels 3+ -4, Statistics in the Media, Snack Attack, pages 22-23
A classmate
Before the students begin this activity, it would be useful to look at the nutritional information on the packaging of various food items. The students may need to find out what the various categories mean. For example, sugar is a simple carbohydrate and is therefore part of the total carbohydrate content. They may also be interested in knowing what the benefits of the different nutrients are (for example, carbohydrates give energy, whereas protein is good for muscle regeneration and growth) and, therefore, when one might be interested in eating the product (for example, before or after exercise).
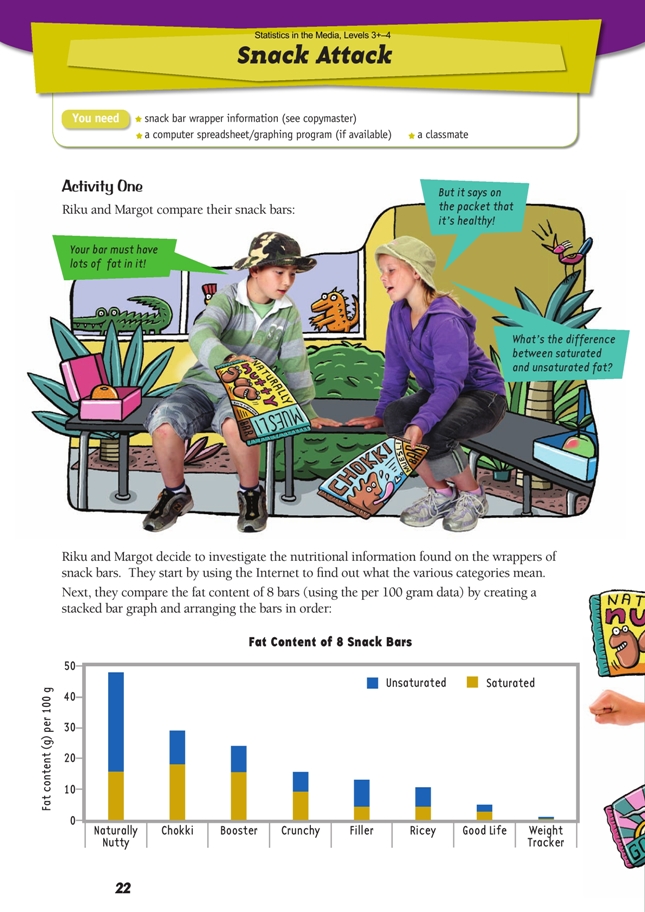
For question 1, base discussion around the total fat (shown by the length of the bars in the graph) and the proportion of unsaturated fat to saturated fat. (Students may already know that it is necessary to have some fat in the diet and that unsaturated fat is better for you than saturated.)
For question 2, the students need to again look at the proportions as well as the length of the bars in their graphs. (The carbohydrates that are not sugar are complex carbohydrates that give longer-lasting energy.)
The data points on the scatter plot produced for question 3 are widely scattered, not in a line. (Straight lines on scatter plots can in fact be of dubious value because they can distract from the real relationships by focusing on irrelevant expectations.) The graph shows that there isn’t a clear correlation between fat and carbohydrate. There seems to be a slight tendency for bars that are high in one to be low in the other. To answer question 3b, the students need to identify the various bars that each point represents. They could label these on a printout of their graph. The students may find it useful to copy the table below into the spreadsheet. This gives them a multivariate data set in the usual format. They can use only the required columns when making
graphs. (The graphs shown for 3b in the answers are examples only.) Your students may also be interested in creating other graphs to look at other relationships, such as sugar and total carbohydrates.
Question 4 encourages students to be critical of advertising claims. Discuss with your students the ways in which manufacturers can use statistics (or data) to make claims that promote their product. An extension activity would be to think of the aspects of each bar that could be promoted (for example, high levels of protein) by advertisers.
Activity Two
Instead of the task given, you may like to have your students fi nd the nutritional information of two popular lunch products and compare these.
The students could also collect wrappers from their lunches or from home and construct a multivariate data set (in the form above) from the information on the wrappers. They could also add more variables, such as what they like about each bar.
Students need to think about: “Where did this data come from?” “Are the values actually the recipe the manufacturers aim at making?” “Are laboratory tests done, and if so, how often?” “Why are there batch numbers on products?” The answers may be in legislation or on company websites.
Answers to Activities
Activity One
1. Discussion will vary. Examples of comments are:
• All bars have at least some fat content, although Weight Tracker looks like it only has about 1 g.
• The amount of unsaturated fat is higher than saturated fat in the Naturally Nutty, Filler, Ricey, and Weight Tracker bars.
• Naturally Nutty has by far the highest combined fat content, and Weight Tracker has the lowest.
• Chokki has the highest saturated fat content.
• Six of the 8 bars have at least 10 g fat content per 100 g, with 3 bars having over 20 g fat content per 100 g.
2. a. A possible graph is shown below. Note that sugar is part of the carbohydrate fi gure, although it is also shown separately. The top of each bar in the graph below shows the total carbohydrate. So this graph has 3 variables: total carbohydrate, non-sugar carbohydrate, and sugars. (You could sort on any one of these variables.)
b. Discussion will vary. Examples of comments are:
• The carbohydrate content varies greatly from bar to bar.
• Ricey has the highest carbohydrate content.
• Chokki has the highest sugar content.
• Naturally Nutty has the lowest carbohydrate content.
• Five of the bars have more sugar carbohydrates than non-sugar carbohydrates.
3a.
b. Bars that are relatively low in fat and high in carbohydrate are: Weight Tracker,
Filler, Crunchy, and Ricey.
Only 1 bar is low in carbohydrate but high in fat: Naturally Nutty.
Only 1 bar is relatively low in both fat and carbohydrate: Good Life (although its
carbohydrate is mainly sugar, so it’s not necessarily a healthy option, despite its
name).
Only 1 bar is relatively high in both fat and carbohydrate: Chokki.
c. Discussion will vary. There may be a tendency for bars that are high in total
carbohydrates to be low in fats. The scatter plots give some useful comparisons.
Bar graphs (for example, the one on page 22 of the students’ book or that shown in
the answers for question 2a) give a more detailed view of one set of variables.
4. a. Discussion will vary. The Booster bar has 1 830 kJ of energy per 100 g. This is one of the higher energy ratings. However, high energy does not always equal
goodness. High energy implies high levels of carbohydrates, including sugar. This
bar also has more fat than most of the other bars.
b. The Booster bar has 47.6 g of carbohydrate per 100 g, which is the third lowest
carbohydrate content of the 8 bars. (Although if you are comparing per
serving size, this bar has the second highest carbohydrate content.)
Activity Two
1. Bars chosen will vary. The example below compares Booster with Naturally Nutty.
2. Discussion will vary. Per 100 g gives a more realistic picture of the proportion of contents than the serving size does because of the differences in serving sizes. The per 100 g would be useful for comparing the amount of sugar and fat, for example, in the bars. The mass values here, in grams, immediately become percentages (by mass). On the other hand, because people usually eat one serving rather than 100 g, someone who is watching their weight (or fat intake) or is a diabetic (watching their
sugar consumption) may be more interested in the amount of fat or sugar they will consume with 1 serving of each bar.
Key Competencies
Snack Attack can be used to develop these key competencies:
• thinking: investigating, interpreting, analysing
• using language, symbols, and texts: using ICT as appropriate, using appropriate units
• relating to others: working co-operatively
• participating and contributing: sharing strategies and thinking.