This is a level 3 measurement activity from the Figure It Out theme series.

Click on the image to enlarge it. Click again to close. Download PDF (692 KB)
measure time using a stopwatch
measure lengths with a tape measure
discuss patterns found in results
FIO, Levels 3-4, Theme: Sport, On the Slippery Slope, pages 10-11
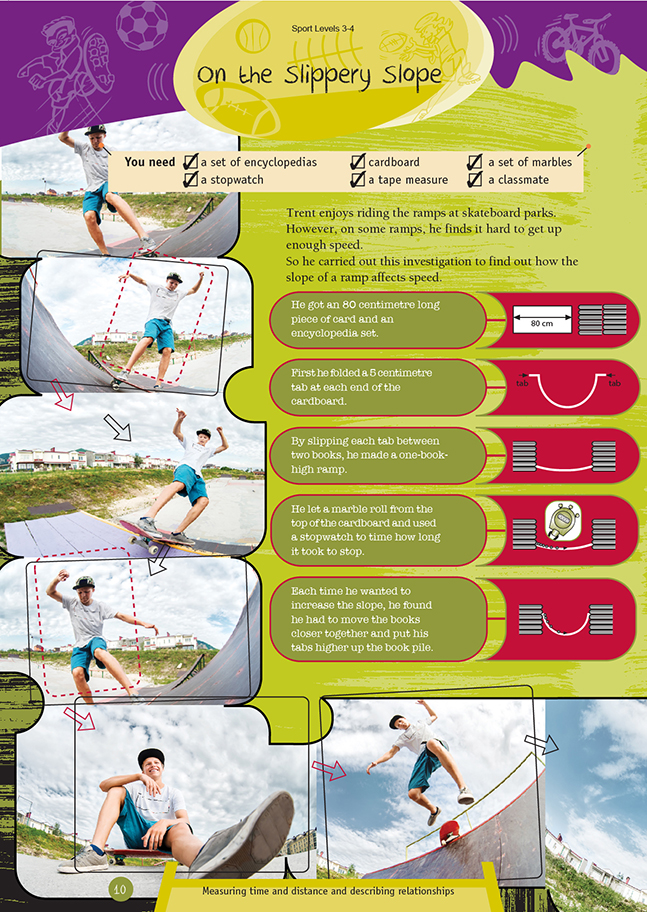
A set of encyclopedias
Cardboard, a tape measure
A set of marbles
A stopwatch
A classmate
Investigation
The students will need to use cardboard that is flexible enough to curve evenly along its length. Strong cartridge paper or poster card is about the right thickness. As well as being 80 centimetres long, the cardboard needs to be at least 30 centimetres wide so that the marble is less likely to roll off the side. The students also need to make sure that when the cardboard is set up between the books, it doesn’t slope to one side because this could make it roll off the side.
Discuss the following potential problems with the students before they start the investigation:
• How will they decide when the marble is finally at rest? (This should be when it stops moving up and down the ramp.)
• How will they cope with variable measurements? (One approach is to take three or five measurements and use the middle measurement.)
• How will they record their data as they gather it? (A table is ideal, and they can enter it into a spreadsheet in order to graph it.)
Here are the results of one experiment: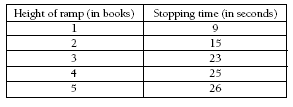
When graphed, the data looked like this:
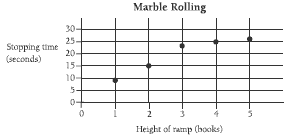
The line on the graph shows that increasing the height of the ramp causes an increase in the rolling time of the marble, but this increase tapers off as the height gets beyond a certain point.
Larger marbles will probably roll for a slightly longer time than smaller marbles, given the same height ramp. The distance travelled up the ramp is high on the first rolls but becomes increasingly smaller. The final up and down movements are very small.
Answers to Activity
Investigation
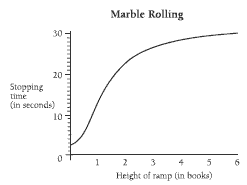
The points on the graph for Quinten’s first investigation should follow an “S” curve, like this:
Quinten’s other investigations:
a. The mark a marble rolls up to on each side follows a pattern like this:
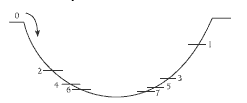
With each roll of the marble, the distance between the points gets smaller and smaller.
b. The steeper the ramp becomes, the faster the marble rolls, and therefore the further it rolls after leaving the ramp. However, as the ramp gets steeper, friction affects the rolling distance, and the gain in distance becomes less and less each time the ramp is made steeper.