This is a level 5 algebra activity from the Figure It Out theme series.
Click on the image to enlarge it. Click again to close. Download PDF (144 KB)
make a graph from a data table
interpret a relationship shown on a graph
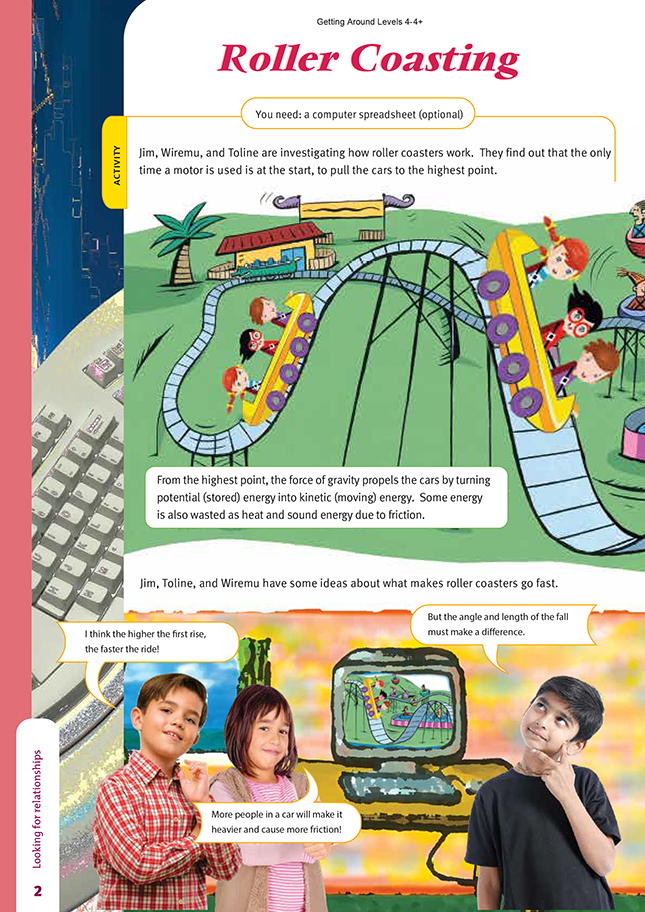
FIO, Levels 4-4+, Theme: Getting Around, Roller Coasting, pages 2-3
A computer spreadsheet (optional)
In this activity, students identify factors that influence the speed of roller coasters.
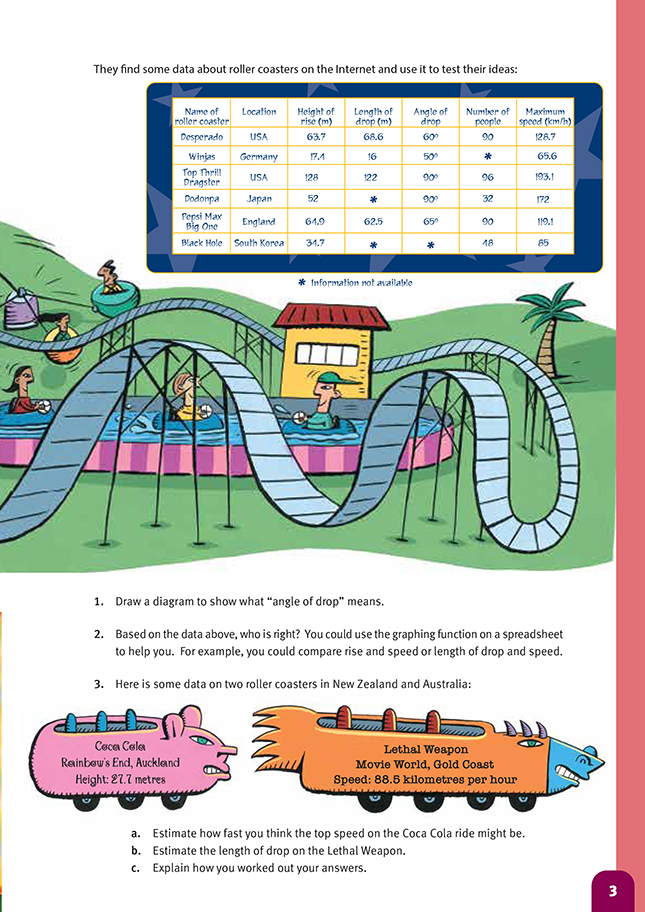
Entering the data on a spreadsheet will enable the students to look for relationships between the data fields and the resultant speeds. For example, if an XY graph is created, with speed plotted on the vertical axis and height of rise on the horizontal axis, an interesting relationship is revealed. This is shown in the graph in the Answers. There is a clear relationship between the height of rise and the speed: the bigger the rise, the higher the speed. A similar relationship is found between the speed and the length of drop (see the graph in the Answers). There is no such relationship between the number of people and the speed (as an additional graph would show clearly). For example, the Dodonpa takes only 32 people but screams along at the second
fastest speed.
The students might comment on the gaps in the data. If they do, discuss this with them and point out that, in most cases, the fact that data is missing does not invalidate conclusions drawn from the data that does exist.
Question 3 calls for interpolation, that is, estimating missing values based on known relationships. The Coca Cola ride has a height lying somewhere between Winjas and the Black Hole but closer to the Black Hole. The ratio of the Coca Cola ride’s height to that of the Black Hole is 27.7 : 34.7. If we used this ratio, the speed of the Coca Cola ride would be 85 x (27.7 ÷ 34.7) = 67.9 km/h. The actual speed achieved by this coaster is 72 km/h, so our interpolation is reasonable.
To determine the drop length of the Lethal Weapon, a graph of the speed plotted against the length of drop as in the Answers provides an excellent guide. There is clearly a close linear relationship between the points. From this, we can extrapolate that the drop will be somewhere around 35 metres. In reality, however, the
drop is 29 metres. This indicates that the angle of drop must be very steep.
Cross-curricular links
As a group, the students could identify a possible heritage site in the local area that could be developed as a tourist attraction. They then devise an impact report for the local council that identifies the key features of that place or environment, its historical value for the range of groups in the area, and the impact that the development would have on the local people’s lifestyles and environments. The report should include the
positives and negatives that the council needs to consider and conclude with a justified recommendation.
Achievement Objectives
Social Studies
Demonstrate knowledge and understandings of:
• how and why people view and use resources differently and the consequences of this (Resources and Economic Activities, level 4)
• the impact of the spread of new technology and ideas on culture and heritage (Culture and Heritage, level 4)
Health and Physical Education
• access and use information to make and action safe choices in a range of contexts ( Personal Health and Physical Development, level 4)
• specify individual responsibilities and take collective action for the care and safety of other people in their school and in the wider community (Healthy Communities and Environments, level 4)
Answers to Activity
1. Your diagram should look something like this:
.gif)
2. Rise, length of drop, and angle of drop all affect the speed, so Jim and Wiremu are both right. The number of people in the train does not appear to have much effect.
If you put the figures into a spreadsheet and make graphs from them, they would show that there is a definite connection between rise and speed (see the graph in the next column), but that the angle of drop (for example, for the Dodonpa) can
increase the speed still further.
The graph at the top of the next page shows that there is a very strong connection between the length of the drop and the speed.
3. a. Coca Cola reaches a top speed of 72 km/h. Estimates will vary.
b. Estimates will vary, but most should be about 35 m. (Lethal Weapon actually drops 29 m.)
c. Explanations will vary. The speed of the Coca Cola roller coaster can be estimated from the first graph by drawing a vertical line through the point on the horizontal scale that represents 27.7, noting where it cuts the graph, then reading across to the vertical scale from that point. The drop of the Lethal Weapon roller coaster can
similarly be read from the second graph. Draw a horizontal line through the vertical axis at the point representing a speed of 88.5 km/h. Note where it cuts the graph, and from this point draw a line vertically until it cuts the horizontal axis.
The point at which it cuts this axis is a reasonable estimate for the drop.