This is a level 3 and 4 statistics activity from the Figure It Out series.
A PDF of the student activity is included.
Click on the image to enlarge it. Click again to close. Download PDF (1349 KB)
decide which graph best shows the data clearly
make conclusions based on the data
construct a bar graph
interpret/evaluate statements made about the data
This diagram shows the areas of Statistics involved in this activity.
The bottom half of the diagram represents the 5 stages of the PPDAC (Problem, Plan, Data, Analysis, Conclusion) statistics investigation cycle.
FIO, Levels 3-4, Statistics Revised Edition, Reading Trends, pages 8-10
A classmate
Activity One
In this activity, multivariate category data is summarised in a frequency table. The data is merged so that year-group and gender distinctions disappear and two graphs highlight the relative popularity of different authors.
In question 2, the students use a computer to create two further graphs that use the same (merged) data. Three possibilities are given in the Answers. Out of all the options, a bar graph (vertical or horizontal) with the authors sorted according to popularity may be the best.
Be aware that, when using a computer to graph category data, it is not obvious how to get the category labels on the graph. In some graphing programs, the procedure is to forget the category names and select only the number (frequency) data when choosing and creating the graph. Add the category labels as a second stage: click on the graph you have created to select it, go to the Chart menu, click on Source data, then the Series tab. Insert the cursor in the Category (X) axis labels box and then select the cells in the spreadsheet that contain the category labels. Click OK.
Discourage your students from using the unusual and three-dimensional graphs that may be on offer. These are almost always more diffi cult to read than two-dimensional graphs, particularly when it comes to making comparisons between two categories or sets of data. Clarity and simplicity should be the aim.
Activity Two
This activity requires the students to create and/or interpret three double bar graphs. Encourage them to sort the data in the spreadsheet in ways that might be useful (for example, order of popularity with boys). As they do this, the bars of their graphs will automatically rearrange themselves to match. By sorting one of the variables, the students will fi nd it considerably easier to spot signifi cant features and patterns.
Before starting this activity, students should have had some practice at writing statements about data in graphs. For examples, see the earlier activities in this book, School Crossing and Change Ahead! See also the Level 3 Statistics book.
Activity Three
In question 1, the students go back to the tables and graphs they have used and/or created and do a little detective work. In addition to naming the author(s) in each case, they should cite the supporting data (as in the Answers).
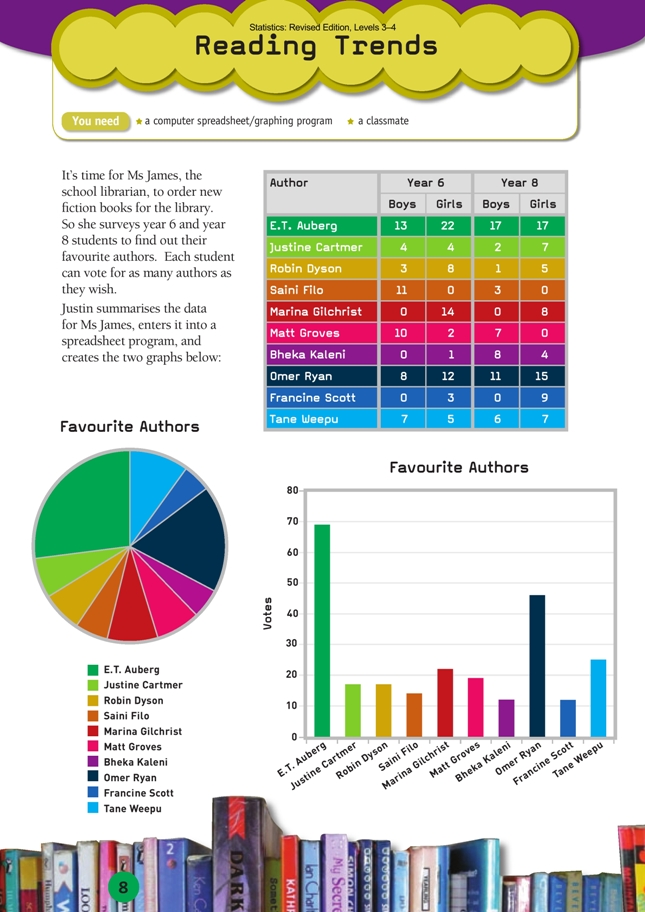
Question 2 is designed to make the students think about the size of the sample from which these statistics have been drawn. To answer the question, they need to have read the introductory paragraph and have seen that students can vote for as many authors as they wish. This means that they can’t know how many students voted. It does not mean, however, that we know absolutely nothing about the sample size: 69 votes were cast for E. T. Auberg, so we know that at least this number of people took part in the survey (assuming, of course, that no one voted more than once for E.T. Auberg!)
Answers to Activities
Activity One
1. The bar graph shows the information more clearly because you can read appropriate numbers of votes from the left-hand axis. You can’t do this from the pie graph, although the pie graph does clearly show the most popular authors.
2. Graphs will vary. Here are three possibilities:.
3. Opinions and explanations will vary. All will show that E. T. Auberg is the most popular, with Omer Ryan a clear second.
Activity Two
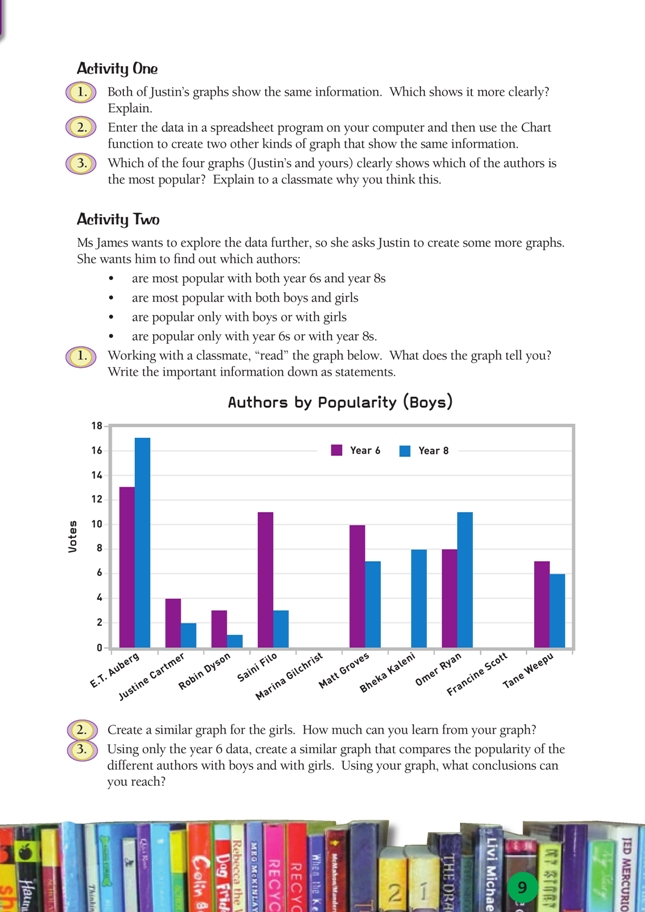
1. Possible statements include:
Bheka Kaleni is popular only with boys in year 8.
Marina Gilchrist and Francine Scott are not popular with boys.
E. T. Auberg is the most popular author for boys in both year 6 and year 8.
Only 3 of the 10 authors (E. T. Auberg , Bheka, Kaleni, and Omer Ryan) gain in popularity with boys between years 6 and 8.
2. One possible graph (in this case, arranged alphabetically by surname) is:
Statements will vary. For example: E. T. Auberg is the most popular author with both year groups; Saini Filo is the least popular; Matt Groves and Bheka Kaleni are not very popular with girls.
3. One possible graph is:
Conclusions will vary. For example: For year 6students, E. T. Auberg is much more popular with girls than boys; there are two authors that the boys are not interested in at all; there is no outstandingly most popular author for boys; the most popular author for girls is E. T. Auberg.
4. Investigations, graphs, and stories will vary.
5. Recommendations will vary. For example, she should buy as many books as possible by E. T. Auberg , who is popular with both boys and girls. Perhaps she could buy multiple copies of books by this author.
Activity Three
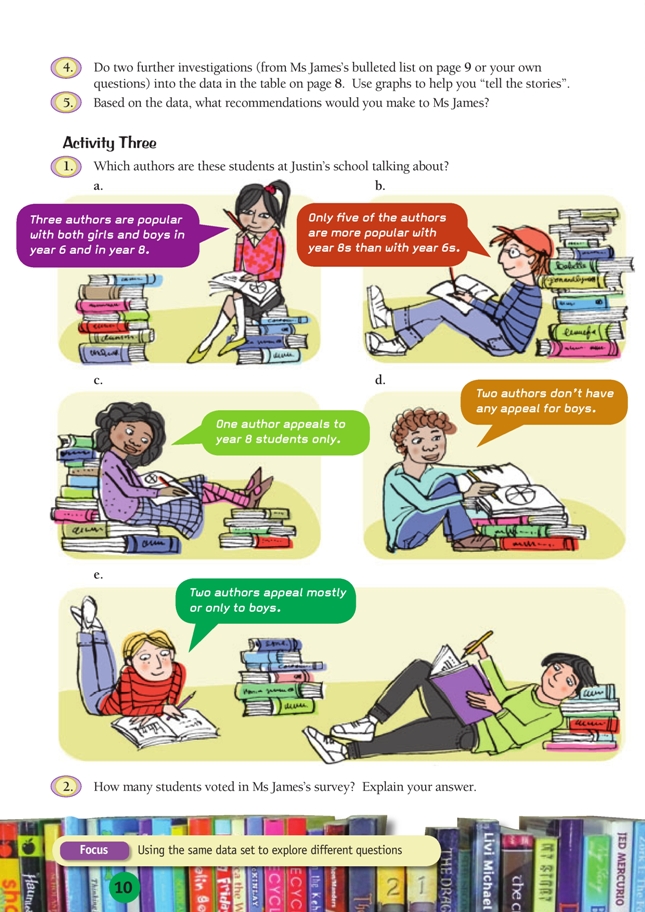
1. a. E. T. Auberg (more votes from all four groups than for any other author), Omer
Ryan (second in terms of total votes and a minimum of 8 votes from all four groups),
and Tane Weepu (third in terms of total votes; votes were evenly spread across all
four groups).
b. The speaker is talking about total votes from each year group. The five authors
are Justine Cartmer (8→9 votes), Bheka Kaleni (1→12), Omer Ryan (20→26),
Francine Scott (3→9), and Tane Weepu (12→13).
c. Bheka Kaleni. (This author received only a single year 6 vote.)
d. Marina Gilchrist and Francine Scott. (Both authors received no votes at all
from boys.)
e. Saini Filo (no votes at all from girls) and Matt Groves (this author received only
2 votes from girls)
2. You can’t tell because students could vote for as many authors as they wished. All that you can know for sure is that at least 69 students voted, because this is the greatest number of votes received by any one author.
Key Competencies
Reading Trends can be used to develop these key competencies:
• thinking
• using language, symbols, and texts.