This is a level 4 statistics activity from the Figure It Out series.
A PDF of the student activity is included.
Click on the image to enlarge it. Click again to close. Download PDF (910 KB)
evaluate statements made about graphs
Before setting this task, see the comment in the notes for Surf Stats (pages 8–9 of the students’ book) on the graphing of time-series data.
It may be worth playing Mad Minute with your class several times so that they understand the concept and can collect some local data for analysis.
This activity will be most effective when followed by a discussion of the answers that your students write for the questions. The goal is to develop a common language for interpreting and describing time-series data.
Students working at levels 4 and 5 of the curriculum should be understanding and using terms such as trend, plateau, and peak.
As an extension, you could get your students to try Mad Minute starting with the numbers 1, 1 and then ask them if they recognise the sequence they have just written down. This sequence, 1, 1, 2, 3, 5, 8, 13, 25 …, is known as the Fibonacci sequence. Interested students could research this fascinating sequence using the
Internet. They could then report their findings to the whole class.
Answers to Activity
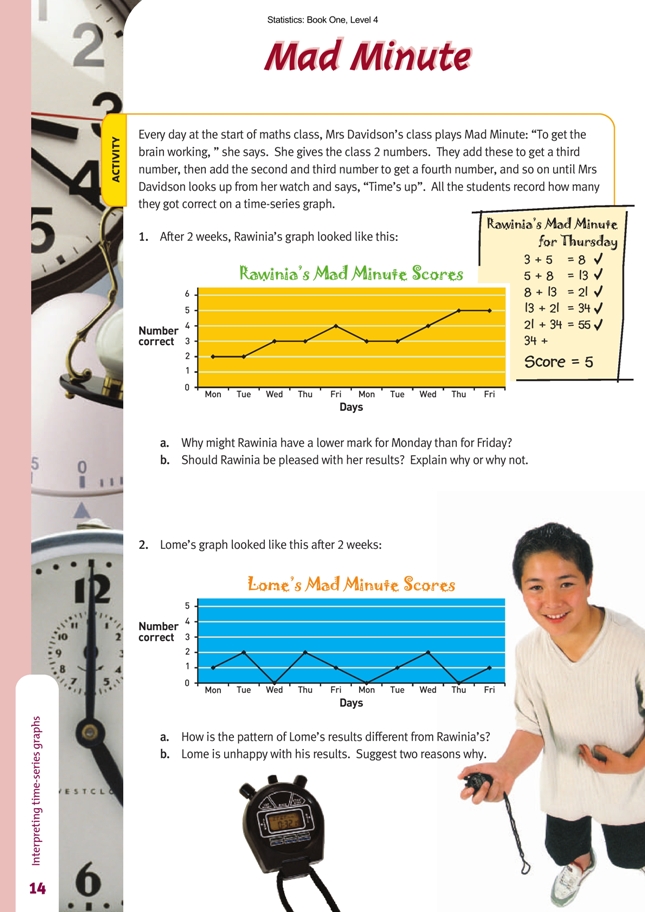
1. a. Answers will vary. For example, the numbers on Monday were harder, she was tired after a busy weekend, she was out of practice, and so on.
b. Yes. She has improved from getting only 2 correct on Monday and Tuesday of the first week to getting 5 correct on the Thursday and Friday of the following week.
2. a. Rawinia’s worst score is Lome’s best score.
Rawinia’s scores are generally improving, but Lome finishes the 2 weeks with the same score that he started with.
b. His results are up and down and not very high. His worst score was 0, and he got this three times. His best score was 2. There is no evidence of improvement.
3a.
b. Comments will vary. Peter consistently improved over the 2 weeks except for the second Wednesday. He may have been absent from school that day, or he may have added the first and second numbers incorrectly and got all the others wrong as a result.
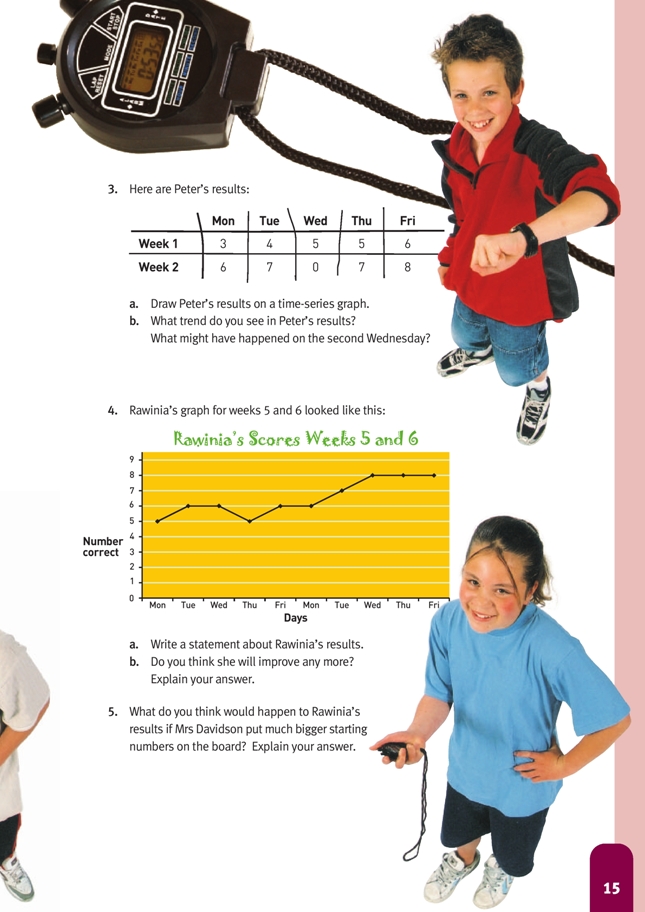
4. a. Statements will vary. Rawinia has shown a steady improvement and is consistently scoring 8 by the end of the week.
b. Comments will vary. There is not enough evidence to show for certain whether she has peaked or has simply reached a plateau and is spending some time there before improving further.
5. It would take Rawinia longer to work out the answers, so she would probably get fewer right.