This is a level 3 statistics activity from the Figure It Out series.
A PDF of the student activity is included.

Click on the image to enlarge it. Click again to close. Download PDF (1375 KB)
create a time-series graph
interpret the features of the graph
compare two graphs
This diagram shows the areas of Statistics involved in this activity.
.gif)
The bottom half of the diagram represents the 5 stages of the PPDAC (Problem, Plan, Data, Analysis, Conclusion) statistics investigation cycle.
Statistical Ideas
Logging On involves the following statistical ideas: creating and interpreting time-series graphs and using the PPDAC cycle.
A computer spreadsheet/graphing program (optional)
FIO, Levels 3+ -4, Statistics in the Media, Logging On, pages 12-13
A classmate
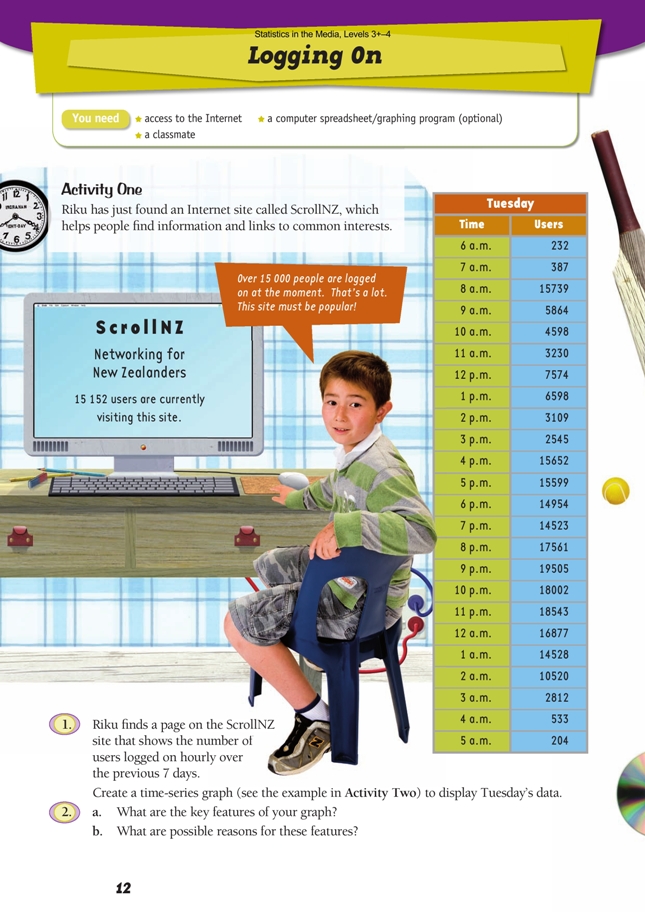
Activity One
A time-series graph shows change in a variable (for example, cost, weight, profi t, audience) over time. It is important that students notice that the graph they draw for this activity shows the change in user numbers over the day much more clearly than the table of data does. If students give their Activity One graph (see the example in the answers) the same scale as their graph for Activity Two, they will fi nd it much easier to make comparisons between the two graphs. (However, graphing both series on the same chart, as suggested below for Activity Two, is a very effective
way to show the differences.)
Activity Two
The obvious way to compare the two websites is to graph both series on the same chart. The table supplied here contains the raw data for U–MeSwap, which students can use if they wish to create a graph with both series on the one set of axes (see the graph on the next page). The ScrollNZ data is on the students’ book page.
The resulting graph would look like this:
Answers to Activities
Activity One
1. Graphs will vary, depending on the scale used. The graph below goes up to 80 000 on the vertical scale, as does the graph in Activity Two. Although this is not necessary, it is helpful when you come to compare the two graphs later.
2. a. Key features should include: a peak at 8 a.m., followed by a trough in midmorning; a slight rise at lunchtime, followed by a decline, then large numbers
in mid–late afternoon and throughout t heevening, slowly tailing off after 11 p.m.
b. Answers will vary, but the 8 a.m. peak could be a quick check of the site before
leaving for school or work; the lower numbers during school hours are perhaps
because many users of the site are school students; the late afternoon and night-time
pattern fi ts with most people’s after-school and after-work hours.
Activity Two
1. a. The number of users increases fairly steadily throughout the day, peaking at 9
p.m. and then declining sharply over the next 3 hours. The lowest number of users
is between 2 a.m. and 6 a.m.
b. The graph shows an activity pattern that is similar to those of actual Internet auction sites. People involved in Internet auctions often check their bids or auctions during the day (although some workplaces block certain popular sites); 7–9 p.m. is the time of evening when most people are at home (some of these people will have already logged on during the day). Most people putting goods or services up for Internet auction will avoid having the closing time later than 10 p.m. because that would limit the number of viewers or bidders.
2. a. Comments will vary. U–MeSwap has considerably more users than ScrollNZ at
all times; the most popular times for both websites are from mid-afternoon onwards;
U–MeSwap peaks at 9 p.m. (a sensible time for auctions to fi nish) and then
sharply declines, whereas the number of ScrollNZ users is reasonably constant
between 4 p.m. and 12 a.m.; U–MeSwap has a more or less increasing number of
users during the day, whereas, apart from the 8 a.m. surge, ScrollNZ’s daytime
numbers are low up to 3 p.m.
b. Reasons will vary. For example, Internet auction sites are very popular and will
usually have more users than general interest or information sites; from mid-
afternoon, users of both sites will probably include students or workers who have
limited or no time for access during the day; student use may account for the 4 p.m.
surge in ScrollNZ numbers; U–MeSwap users will include adults accessing the site
from home or work during the day; most people access sites such as these from late
afternoon through to bedtime.
Key Competencies
Logging On can be used to develop these key competencies:
• thinking: investigating, interpreting, exploring and using patterns and relationships in data
• using language, symbols, and texts: communicating fi ndings, using ICT as appropriate
• relating to others: co-operating
• managing self: seeking understanding
• participating and contributing: working in groups with everyone contributing.