This is a level 5 algebra strand activity from the Figure It Out series.
A PDF of the student activity is included.
Click on the image to enlarge it. Click again to close. Download PDF (187 KB)
interpret a relationship shown by a graph
FIO, Level 4+, Algebra, Book Four, Jam Jars, page 24
square grid paper
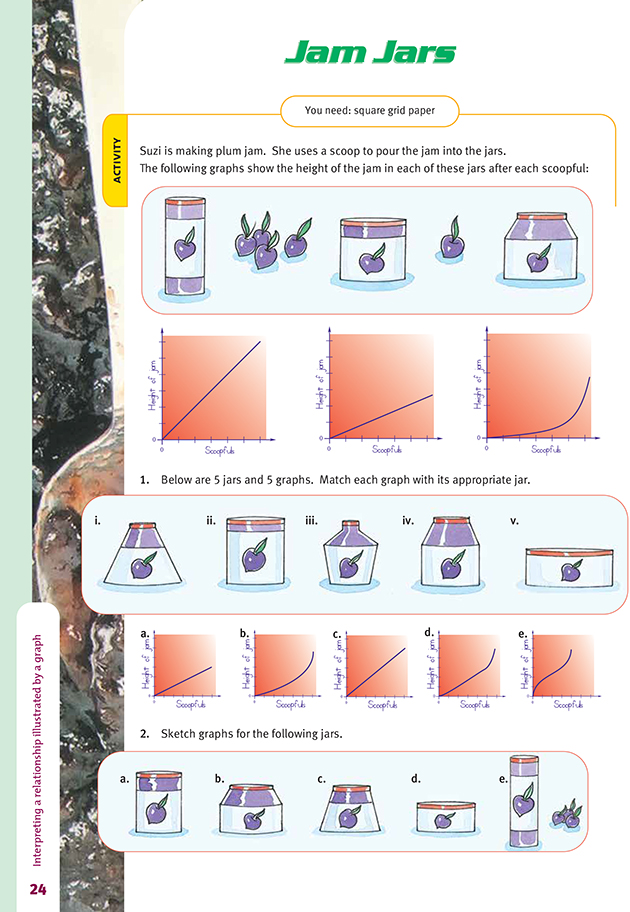
In this activity, the students match graphs with the objects (jam jars) that are most likely to have led to the graphical representations.
In each case, they must try to visualise the rate at which the height of the jam changes as each scoopful is added. In some of the later examples, this can be quite challenging, and the students should be encouraged to “read” the graphs for clues. For example, the vertical axis measures the height of the jam in the jar. When
the jar is full, the line stops, and therefore this point marks the height of the jar. It follows that the relative heights of the jars should be reflected in the relative heights of the graphs for these jars.
There is a further subtlety that the students need to grasp. They may be tempted to conclude that the height of the graph reflects the total volume of the jar and to use this idea to help match jars to graphs. In fact, as we have seen, the height of the graph measures the height of the jar. The volume of the jar is measured by the number of scoops of jam it contains, so the further a graph extends on the horizontal axis, the greater the volume of the jar.
In order to set “benchmarks” against which the graphs for different jars can be compared, students might begin by exploring what happens with three particular jars. The simplest type is a cylinder:
The first graph shows how the height increases as each scoopful is added to the jar. The second graph is made by joining the points in the first graph. The graph is a straight line that shows the height increasing at a steady or constant rate.
While this is not actually the case (the jars are being filled a scoop at a time), we can model the situation in this way without losing any important information. This is a common event in mathematical modelling, where we often simplify in order to assist our calculations or understanding.
The second and third jars that might be investigated are cone shaped. Figure 1 below shows a jar that is part of a cone. It is narrower at the bottom than at the top. Figure 2 shows part of a cone that is narrower at the top than at the bottom. Their graphs are shown below.
For the jar in figure 1, the rate at which the height of the jam increases gradually slows down. So the graph curves “down”. For the jar in figure 2, the rate at which the height of the jam increases gradually speeds up. So the graph for this jar curves “up”.
Note that the jars have the same height and the same volume (one is simply the other turned upside down), so the graphs for the two jars finish at the same height and extend the same distance to the right. In fact, the curves are identical if rotated through 180 degrees around a point halfway between the start and end points of the curve.
The shapes of the jars in questions 1 and 2 are a mix of cylinders and parts of cones. The graphs of these “composite” containers will therefore be a mix of the three graphs above. The students will find it very helpful to describe how the height changes before they begin drawing graphs for question 2. For example, in question
2b, they might say: “The height increases steadily for the part of the jar that is cylindrical and then speeds up for the cone-shaped part. So the first part of the graph will be a straight line, and in the second part, the line will curve upwards.”
Answers to Activity
1. i. b
ii. c
iii. e
iv. d
v. a
2. Your graphs should be similar to the following: