This is a level 5 statistics and number activity from the Figure It Out theme series.
A PDF of the student activity is included.
Click on the image to enlarge it. Click again to close. Download PDF (445 KB)
create a graph using a spreadsheet
interpret pattern in a graph
find percentages of a total
A computer spreadsheet or graph paper
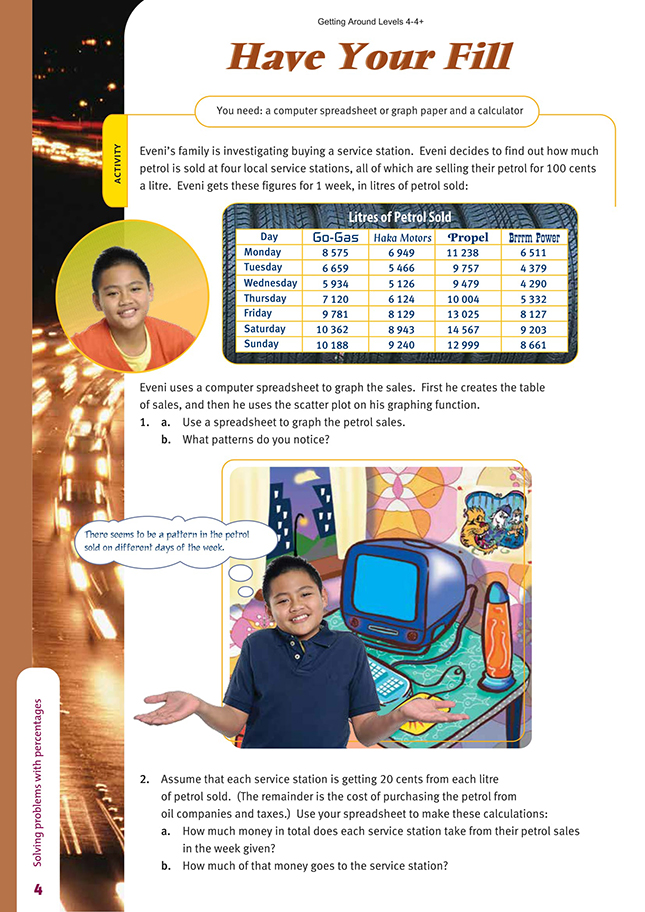
FIO, Levels 4-4+, Theme: Getting Around, Have Your Fill, pages 4-5
A calculator
Creating a computer spreadsheet is the most efficient way of analysing this situation, but it can be done on a calculator as long as the students write their figures down in columns. The graphing part of this exercise is made much simpler by using a spreadsheet. Note that the students should use formulae to determine totals and make other calculations. It makes no sense to create a spreadsheet of data, use a hand-held calculator to perform the calculations, and then enter the results into the cells as “dead” data. Keeping the spreadsheet “live” makes it possible to ask “what if?” questions of the data.
As can be seen in the answer to question 1, weekends are the busiest time for petrol sales. Once the total number of litres sold by each service station is found, the total money taken, or gross sales, is easily found because 1 litre sells for 1 dollar. The revenue earned (after charges and taxes) is 20 cents per litre, which in this scenario is 20 percent. (Note that, in real terms, service stations make about 3 percent profit on the pump price.) The students should be reminded that 20 percent is a ratio, 20 : 100. So the profit of each service station is found by reducing the gross sales by this ratio. For example, Go-Gas’s profit is $58 619 x 0.2 = $11,724. This could be expressed another way using the operator “of”. To find 20 percent of $58 619, we calculate 20/100 x $58,619, which is 0.2 x $58 619 = $11,724 (all values rounded to the nearest whole dollar).
Once the new table has been created for question 3 and the total litres sold found for each service station, the new gross income and net revenue can be determined. In the case of Go-Gas and Brrrm Power, the calculations are straightforward:
Gross sales = litres sold x $1.10. (This includes the new tax.)
Profit = litres sold x $1.00 x 0.2. (The new tax goes straight to the Council. The service station gets 20 percent of the price that the petrol was before the Council tax was imposed.)
Haka Motors chooses to absorb the new tax. So their gross income is still found by multiplying the litres sold by $1.00, but their percentage earnings are halved. Before, Haka Motors earned 20 cents out of every dollar it made. Now it must pay 10 cents to the Council from those earnings. So Haka Motors’ earnings are only 10 cents in every dollar or 10 percent of gross income.
Propel has complicated things a little. Petrol at Propel now costs $1.15 per litre. So its gross income is total litres x $1.15. They now get the original profit of 20 cents out of every dollar plus the additional 5 cents that they have added on top of the levy. They therefore earn 25 cents on every litre of petrol sold, so their earnings equal litres sold x $0.25.
Propel has done better out of the changed pricing regime than the other service stations. In reality, this is an unlikely situation unless Propel is so far away from the other service stations that it is not worthwhile for people to buy their fuel elsewhere. Petrol is a highly sensitive commodity, and people will be influenced by a difference in cost, no matter how small.
Answers to Activity
1. a. The graph from your spreadsheet should look similar to this one:
b. The sales for each of the service stations follow a similar pattern through the week. Propel has the best sales record, followed by Go-Gas and Haka Motors, with Brrrm Power in fourth place. But on Saturday, Brrrm Power outsells Haka Motors. Sales dip at all four outlets during the week, rising on Friday and peaking on Saturday.
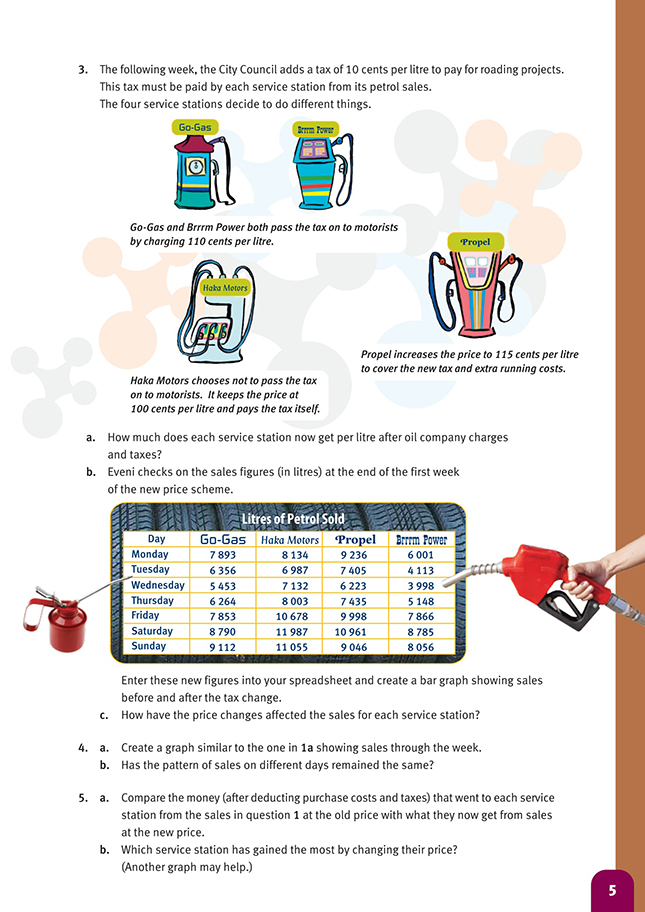
3. a. Go-Gas and Brrrm Power still get 20c for each litre sold:
110c – 80c (costs as before) – 10c (new tax) = 20c.
Haka Motors now gets 10c per litre:
100c – 80c – 10c = 10c.
Propel gets 25c per litre:
115c – 80c – 10c = 25c.
c. See graph above. Go-Gas and Brrrm Power sold slightly less petrol (88.2% and 94.5% of former sales respectively). Propel sold a lot less petrol (74.3% of former sales). Haka Motors sold a lot more petrol (28% more).
4. a.–b. See graph below. The weekly trend continues of sales dipping during the week and then rising to a peak on Saturday.
The before-and-after graph above shows revenue after taxes and oil company charges have been paid. We know that Haka Motors have increased the number of litres sold (see 3a), but it is clear that they have achieved this only by taking a
massive dip in revenue after tax.
The extra graph below shows percentage change in litres sold and revenue earned (after charges and tax). It shows that Haka Motors has increased sales greatly but lost a lot of revenue in the process. The other three service stations have all sold fewer litres. In the case of Go-Gas and Brrrm Power, revenue has dropped in line with a drop in litres sold. Propel has managed to keep its revenue up while selling fewer litres, so its profit per litre has improved. Propel has therefore done better out of the changed price structure than the other service stations.