This is a level 4 measurement strand activity from the Figure It Out series.
A PDF of the student activity is included.
Click on the image to enlarge it. Click again to close. Download PDF (272 KB)
measure and interpret qualitative data
FIO, Level 4, Measurement, Book One, Energy Crisis, page 1
This activity focuses on measuring and interpreting qualitative data, using energy and hunger levels as the subject.
Discuss with the students the important distinction between qualitative measurements (as used in this activity), which require subjective judgments, and quantitative measurements, which can be made objectively using devices or instruments (such as a ruler, watch, multimeter, scales, anemometer, graduated jug, or thermometer). You could ask the students to list as many examples as they can of measuring instruments
and as many examples as they can of both kinds of measurements. They may also like to explore the distinction between counting and measuring.
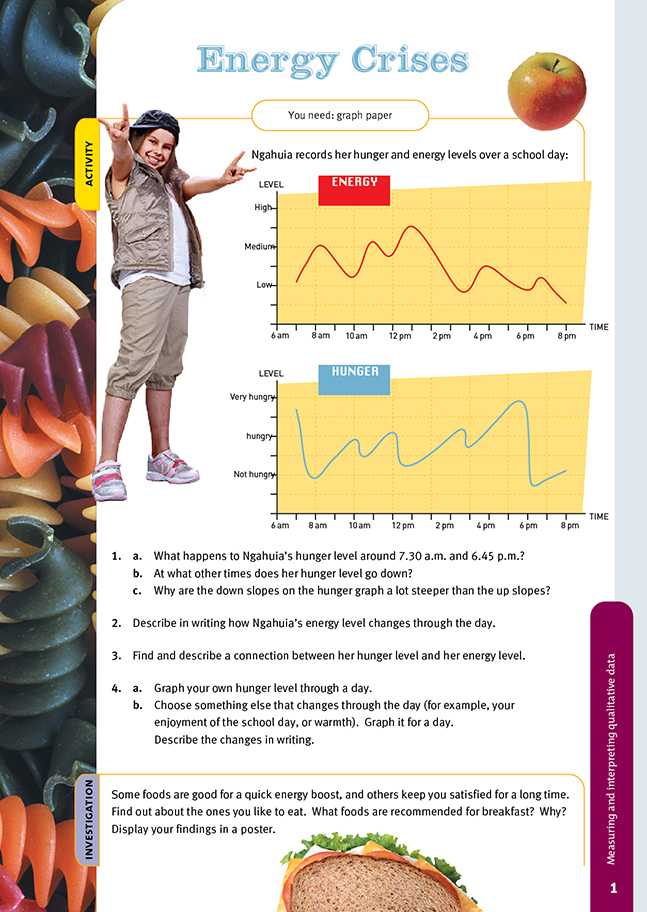
The two graphs are time-series graphs, and every peak, trough, and slope tells its own bit of a story. The challenge is to read the story. Key concepts are positive and negative slope (uphill and downhill as you read from left to right) and maximums and minimums (peaks and troughs).
Both hunger and energy rise and fall through the day, and because the same food that reduces hunger increases energy, there is a relationship between the highs and the lows in the two graphs. One way of demonstrating the relationship would be to make an OHT of the two graphs and then superimpose them. It should be clear that as hunger levels drop, energy levels increase (though there is a short delay in this
happening). The students could see the same connections by using tracing paper to take a copy of one of the graphs and then moving it onto the other.
When doing question 4, the students will need to use a suitable scale (perhaps one marked 1–10) against which to record their levels during the day. They should measure the level (of hunger, happiness, or whatever) every half hour. This will keep them alert to changes. Someone with a watch that can be set to beep every 30 minutes could be assigned as timekeeper.
Investigation
This task gives the students the opportunity to explore good nutrition and to compare this with the “quick shot” energy boosting that is heavily promoted in advertising campaigns. The Internet, nutritionists, the Heart Foundation, and technology and health teachers are all possible sources of information.
A flow diagram or checklist may help the students to plan their investigation:
- Write down the topic or question to be investigated.
- Work out what questions to ask.
- Find out where to look for answers.
- Check with the teacher for appropriateness and safety.
- Collect the information you need.
- Sort and analyse your information.
- Prepare a sketch of your poster.
- Make your poster.
- Explain your poster to the class and have a question for your classmates to discuss, using the information given.
Cross-curricular links
Health and Physical Education
This activity could form part of a unit on healthy eating. As part of this, the students could investigate the effects of advertising on our diets. They could also investigate the major illnesses (for example, heart, diabetes, and cancer) that correlate strongly with poor dietary choices. (See also the activity Fat in Foods in Measurement: Book 2, Figure It Out, Years 7–8) The two books, Choice Food! and Healthy People Eat
Healthy Food from the Curriculum in Action series (Ministry of Education, 1999) are useful resource books.
Achievement Objectives
- identify factors that affect personal, physical, social, and emotional growth and develop skills to manage changes (Personal Health and Physical Development, level 3)
- investigate and describe lifestyle factors and media influences that contribute to common health problems across the lifespan of people in New Zealand (Healthy Communities and Environments, level 4)
Answers to Activity
1. a. It is dropping while she is having breakfast and dinner respectively.
b. Around 10.15 a.m., 12.30 p.m., and 3.45 p.m.
c. Because food quickly satisfies hunger, but the feeling of hunger increases slowly over time.
2. Descriptions will vary. Ngahuia’s energy levels are highest in the morning, peaking after breakfast and lunch, and boosted by morning tea. Dinner and supper give her energy small boosts, but these don’t last long.
3. Her energy level increases immediately after eating and then decreases gradually as the next meal becomes due.
4. a. Graphs will vary.
b. Graphs will vary. Your description should include where the peaks are and why. You may also discuss why some peaks are higher than others.
Investigation
Findings will vary.