This is a level 4 measurement, geometry, statistics and level 5 number activity from the Figure It Out theme series.
Click on the image to enlarge it. Click again to close. Download PDF (148 KB)
interpret information from a timetable
interpret information from a chart
find average speeds
interpret a scale map and draw a route
calculate percentages of money amounts
show percentages on a pie chart
A calculator
FIO, Levels 4-4+, Theme: Getting Around, Day Trippers, pages 12-15
String
Copymaster of the map
Activity One
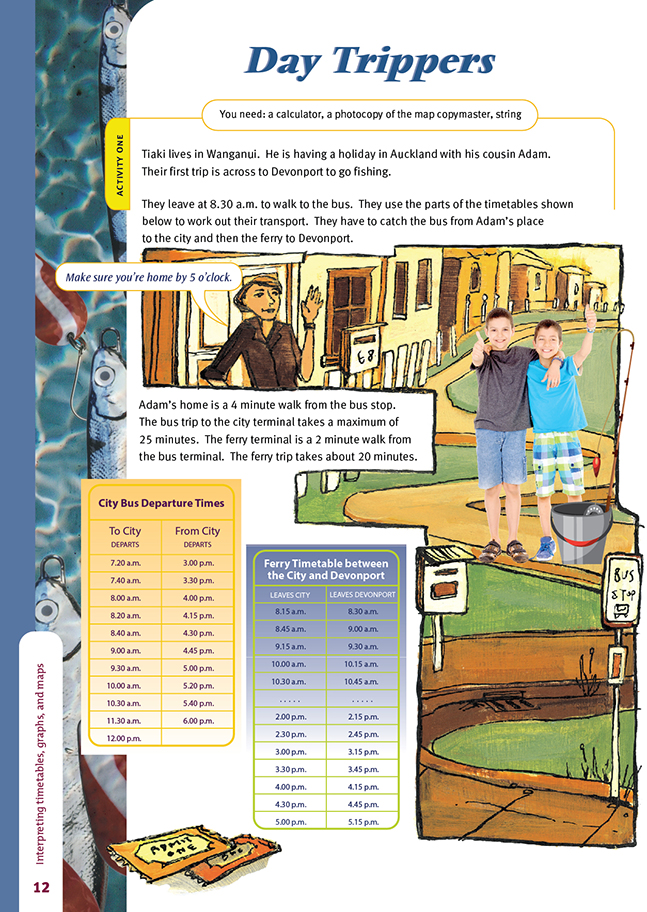
This activity reinforces the work done on pages 10–11. When Adam and Tiaki go to Devonport, the time calculations are straightforward and linear. Leaving home at 8.30 a.m., they arrive at the bus station at 8.30 a.m. + 4 min = 8.34 a.m. The next bus departing for town is at 8.40 a.m., which will have them in the city by 8.40 a.m. + 25 min = 9.05 a.m. Walking for 2 minutes to the ferry takes them to 9.07 a.m., and the
next available ferry is at 9.15 a.m. A 20 minute ferry ride has them in Devonport at 9.15 a.m. + 20 min = 9.35 a.m.
The return trip includes the constraint to be home at 5.00 p.m. If they are to be home by 5.00 p.m., they must start walking from the bus stop at 5.00 p.m. – 4 min = 4.56 p.m. If the bus ride is 25 minutes, it must leave town no later than 4.56 p.m. – 25 min = 4.31 p.m. The latest bus satisfying this condition leaves at 4.30 p.m. (although the boys could also catch the 4.15 bus). Allowing for the 2 minute walk between the ferry terminal and the bus station, as well as 20 minutes for the ferry trip, the boys must leave Devonport no later than 4.30 p.m. – 2 min – 20 min = 4.08 p.m. So the latest ferry they can take is 3.45 p.m.
Using the same process in question 3, the students can find ferry and bus times that will get the boys home by 4.30 p.m.
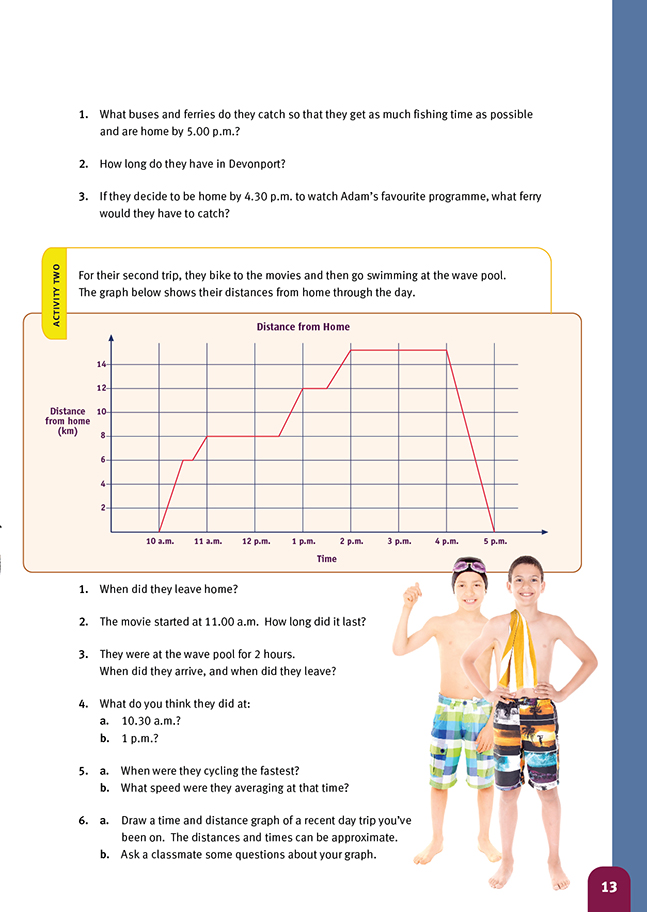
Activity Two
Time-series graphs always tell a story. Exactly what story depends largely on the labelling of the vertical axis (the horizontal one always represents time). The students need experience in interpreting the different features of these graphs:
• A sloping line means that change is occurring. This might be change in distance, sales, profit, population, light, weight, savings, the number of people living in the home, electricity consumption, water flow, Internet usage, the number of pages in a newspaper, in fact, anything at all that changes over time.
• The steeper the slope, the faster the change is occurring.
• A horizontal line means that no change is taking place at that point in time.
• A vertical line means that change has occurred instantaneously.
• A slope can be positive (sloping upwards from left to right) or negative (sloping downwards from left to right). A positive slope always indicates an increase in whatever is being measured; a negative slope indicates a decrease.
• If a line is straight, the rate of change is constant (a steady speed, or whatever, is being maintained).
• A time-series graph is always continuous unless there is a gap due to missing data.
• Where a graph has clear scales, measurements can be taken and calculations made.
Simple graphs like these can be used as a focus for discussion:
In the first graph, persons A, B, and C all travel exactly the same distance (all three lines stop the same distance up the vertical scale). But A travels fastest (shown by steepest slope on the graph) and gets there first (as measured on the horizontal time scale). B travels faster than C and gets there before C.
In the second graph, we are graphing distance from home, not total distance covered. Both D and E travel from home the same distance, but then the distance from home starts reducing until the distance is 0 (zero), which means they are back at their starting point (home). D gets to the destination before E (in half the time, actually, as measured against the horizontal scale), but D and E get home at the same time because D is slower on the return trip.
The following distance–time graph illustrates the progress of the hare and the tortoise on their famous race.
Although not fully labelled, its principal features should be clear. The long horizontal segment represents the time the hare spent asleep (going nowhere). The horizontal line at the top indicates the end of the race.
The circled gap shows that the hare gave up when he saw that the tortoise had reached the finish line ahead of him.
The last graph (below) cannot represent a time–series scenario. Why? Because the backwards sloping segment marked q implies that time can go backwards, which it can’t. For this reason, every next point on a time–series graph must be to the right of the last point plotted.
Activity Three
Back to roller coasters! In this activity, we move from the graphical representation of speed, distance, and time to calculations using different units (metres per second and kilometres per second).
Question 1a asks for the speed of the roller coaster in metres per second.
Distance ÷ time = 485 metres ÷ 78 seconds, which is 6.22 m/s (2 d.p.). For question b, this leads to 22 392 m/h (6.22 x 60 x 60), which is 22.39 km/h. Another way to work out question b is: 485 metres = 485 ÷ 1 000 = 0.485 km. 78 seconds = 78 ÷ (60 x 60) = 0.0216 hours. (There are 60 x 60 seconds in an hour.) The speed of the coaster is therefore 0.485 ÷ 0.0216 = 22.38 km/h (or 22.39 if rounded earlier).
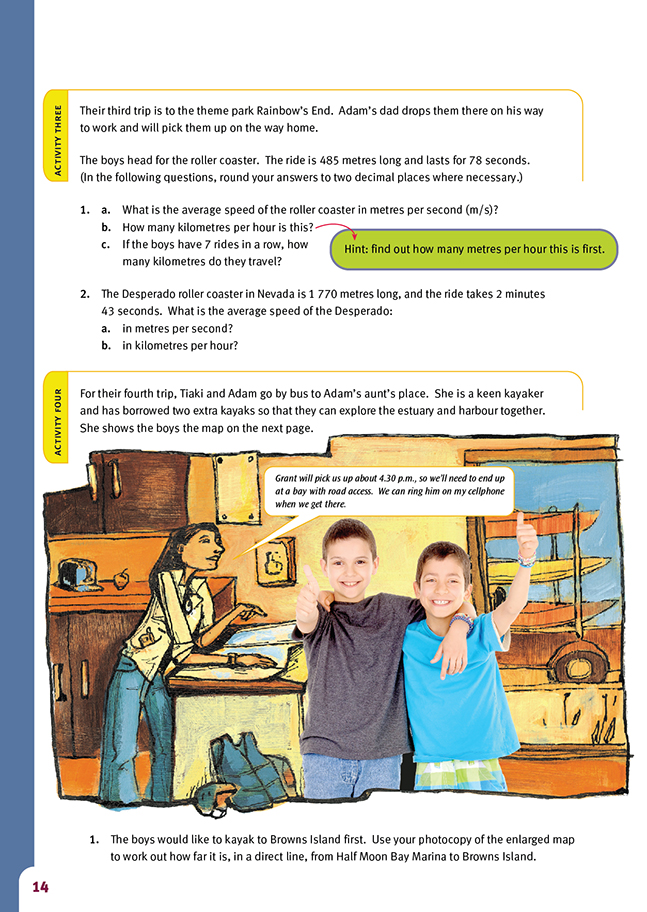
Activity Four
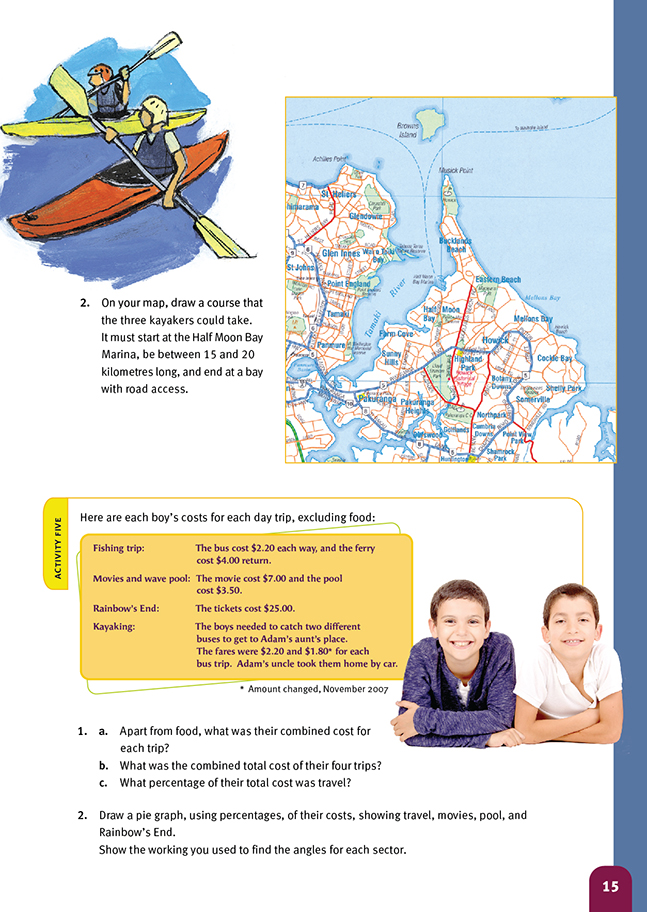
This is an exercise in reading scale maps. On the map given, 1 centimetre represents 1 kilometre, so the students should not find it difficult to select a course of between 15 and 20 kilometres in length because there are many options to choose from.
Activity Five
You will need to teach the students how to organise their data when solving audit problems. If a spreadsheet can be used for this task, use it because it enforces organisation of the data. If not, then a table will do nicely.
The data can be arranged as follows:
The total cost for each trip is then read from the table, and the cost of their transport for the week can be calculated: $8.80 + $8.00 + $4.40 + $3.50 = $24.70. So the percentage of their week’s budget spent on transport is $24.70 ÷ $95.70 = 25.81%.
Drawing the pie graph to represent their expenditure requires the students to divide 360 degrees into appropriate sectors. We know that 25.81 percent of the budget was spent on transport. There are 360 degrees in a circle, so 25.81 percent of 360 degrees or 0.2581 x 360° = 93° (to 1 d.p.) is the size of the angle at the centre of the circle that represents transport. A table will prove useful when determining the size of
the angles for the four different sectors.
When doing tasks like this, the students need to understand that 25.81% = 0.2581, that 14.63% = 0.1463, and so on. It is also important that they do not truncate or round excessively part-way through their calculations because this will affect the accuracy of their result. In this case, the angle should be rounded at the end of
the calculation to the nearest whole degree because protractors cannot be read to a greater degree of accuracy.
A computer spreadsheet program would do a good job of producing the pie chart.
Cross-curricular links
You could present the students with the scenario that another class is to visit the students’ class for the day to share knowledge and skills in relation to the topic they are currently studying. The students could develop ways that they might make the sharing of this knowledge and skills an enjoyable and valuable experience
for everyone involved in the day.
Achievement Objectives
Social Studies
• demonstrate knowledge and understandings of how and why people exercise their rights and meet their responsibilities (Social Organisation, level 4)
Health and Physical Education
• describe and demonstrate a range of assertive communication skills and processes that enable them to interact appropriately with other people (Relationships with Other People, level 4)
Answers to Activities
Activity One
1. a. Catch: the 8.40 a.m. bus to town
the 9.15 a.m. ferry to Devonport
the 3.45 p.m. ferry back to town
the 4.15 or the 4.30 p.m. bus home.
2. 6 hrs 10 min
3. The 3.15 p.m. ferry (to connect with the 4.00 p.m. bus)
Activity Two
1. 10 a.m.
2. 1 hr 30 min
3. They arrived at 2 p.m. and left at 4 p.m.
4. a. Answers will vary. They stopped for 10–12 minutes, which could have been to go to a dairy, chat to friends, adjust a bike part, or any similar activity.
b. Answers will vary. Given the time of day and the length of the stop, they probably stopped for lunch.
5. a. Between 4 and 5 p.m.
b. 15 km/h
6. a.–b. Answers will vary.
Activity Three
1. a. 6.22 m/s (2 d.p.)
b. 22.39 km/h (2 d.p.)
c. 3.40 km (2 d.p.)
2. a. 10.86 m/s (2 d.p.)
b. 39.10 km/h (2 d.p.)
Activity Four
1. Measurements may vary slightly, but they should be between 4.5 and 5 km.
2. Answers will vary. A possible route is from the Marina, south of Browns Island, round Musick Point, and down to Cockle Bay. This is about 15 km on
the map.
Activity Five
1. a. Fishing $16.80
Movies/pool $21.00
Rainbow’s End $50.00
Kayaking $7.90
b. $95.70
c. 25.81% (2 d.p.)
2. The pie graph should be similar to this one:
The percentages (to 2 d.p.) for each expense are:
travel 25.81%
movies 14.63%
pool 7.31%
Rainbow’s End 52.25%
The angles (rounded to nearest degree) are:
travel: 25.81% of 360° = 93°
movies: 14.62% of 360° = 53°
pool: 7.31% of 360° = 26°
Rainbow’s End: 52.25% of 360° = 188°