This is a level 3 statistics and measurement activity from the Figure It Out theme series.
Click on the image to enlarge it. Click again to close. Download PDF (474 KB)
measure distances
measure times
record data on a graph
interpret patterns from the graph
FIO, Levels 3-4, Theme: Sport, Can't Catch Me! page 1
sports shoes
a stopwatch
long tape measure or a trundle wheel
pegs to mark distance
classmates
In this activity, students extrapolate (predict values outside the range of the data they have) to estimate how long they will take to run certain distances. For example, in question 2, the students use their recorded times for running 100, 200, and 400 metres. This is the range of their data. From this data they are asked to predict their time over 800 metres, which is outside this range.
Students also work with extrapolation and interpolation (predicting values within a data range) on page 19 of Algebra, Figure It Out, Levels 3–4 and on pages 18–19 of Measurement, Figure It Out, Levels 3–4.
The time that most 10- to 11-year-old students take to run 200 metres is more than double their 100 metre time. Similarly, their 400 metre time is over double their 200 metre time. This is because they are more tired and have to pace themselves over the whole distance.
A graph of distance against their running time in question 2 would follow this trend:
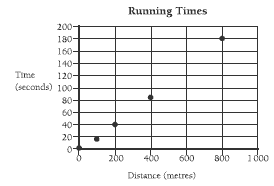
If the students join the points on the graph, they will find that it isn’t a straight-line graph, that is, the relationship between time and distance is not linear. The relationship is not linear because the further the students run, the slower their speed.
As an extension, the students could use interpolation to predict the time they would take to run 300, 500, 600, or 700 metres.
In question 3, students research world records. In the world records as at February 2001 (shown on the following page), the men’s 200 metre time is less than double the 100 metre time. This is because sprinters do not reach top speed until they are at least 50 metres into the race and they lose time on their start. There is no start time involved in the second 100 metres.
The table below shows the world records at February 2001 for 100 metres, 200 metres, 400 metres, 800 metres, and 1 500 metres:
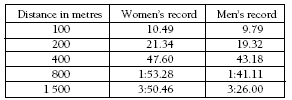
Students may like to get some idea of the speed of these runners by watching a video of an athletics event or trying to ride a bike at 10 seconds per 100 metres (36 km/h), which is approximately the world record speed over 100 metres.
Answers to Activity
1. a.–c. Practical activities. Teacher to check
d. If actual times do not match estimates, it may be because you did not take into
account that the longer the distance, the slower most people run. Also, if you are
not used to running, you may be tired after the first run, and this may affect your
speed on the next run.
2. a.–b. Teacher to check. Graphs and running times will vary, but the slope of the graphs should get slightly steeper for the longer distances.
3. Research activity. Patterns may include: the longer the distance, the slower the speed; men tend to run faster than women