This is a level 3 and 4 statistics activity from the Figure It Out series.
A PDF of the student activity is included.
Click on the image to enlarge it. Click again to close. Download PDF (1980 KB)
construct a time-series graph using a computer
evaluate statements made about the data
This diagram shows the areas of Statistics involved in this activity.
The bottom half of the diagram represents the 5 stages of the PPDAC (Problem, Plan, Data, Analysis, Conclusion) statistics investigation cycle.
FIO, Levels 3-4, Statistics Revised Edition, Bean There, pages 16-17
A classmate
This activity involves creating, reading, and interpreting a four-series time-series graph in some detail. It is followed by an investigation in which students replicate an experiment, following the stages of the PPDAC. This statistical activity could easily be linked to the science learning area of the curriculum.
In question 1, the students use a computer spreadsheet and graphing program to create a time series graph. Depending on the graphing program, steps may include:
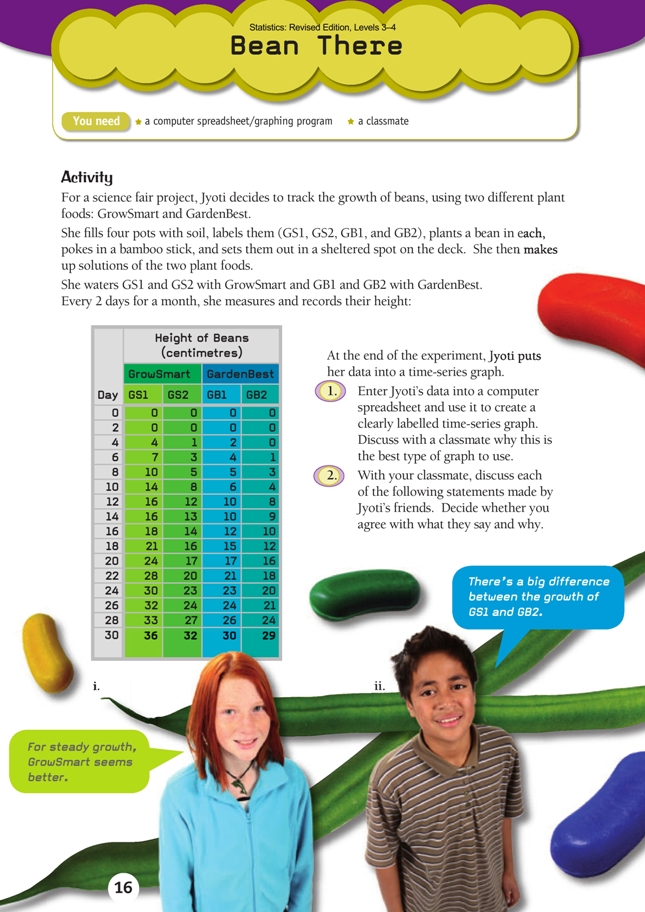
• Open a spreadsheet and enter the data from the table on page 16 of the students’ book. The data can be entered just as it appears in the table but without the title or the GrowSmart and GardenBest headers.
• Select (by dragging the cursor) the data in the four columns headed GS1, GS2, GB1, and GB2 (select the column headers, too).
• Select the Line graph option from the Chart menu. Add the title and axis labels to your graph.
• Go to the Source data menu, click on the Series tab, click cursor in the Category (X) axis labels box, highlight the numbers in your spreadsheet below the header Day (0, 2, 4, 6 …). Click OK in the Source data dialog box.
• If necessary, use the Chart options menu to add or fi x labels.
• If necessary, change the format of the four data lines (for example, make the two GS lines dotted) so that it is easy to see which is which (right-click on the lines for a menu of line types and colours).
In question 2, the students work in pairs to assess the accuracy of various statements made by Jyoti’s friends. They should write their judgments down and justify them with reference to their graphs.
This is a reasonably sophisticated reading and interpretation task. Depending on their experience of graphs and mathematical understanding, the students will need varying levels of support.
Four key areas are:
1. Interpreting the lines: the horizontal axis shows the days of the experiment; each line represents one bean; upward slope indicates growth; the steepness of a line indicates the rate of growth (steeper is faster); horizontal parts of a line mean no growth; we can read how much growth (in centimetres) by referring to the vertical axis.
2. Comparing growth: wherever one line is above another, that bean is taller than the other; where two lines cross each other, one bean is overtaking in height; you can determine the relative heights of the beans on any particular day by reading values off the vertical axis.
3. Making generalisations: while the table and the students’ graphs contain a lot of data, a picture does emerge; statements that broadly describe this picture are known as generalisations; false generalisations can be refuted with reference to the data or to
experimental procedure.
4. Experimental procedure: certain conditions must be met if a science experiment is to be fair. Some of the statements on page 17 require some awareness of these conditions (for example, statement ix, which relates to the notion of a “control”).
Note that statement v requires the students to consider what might happen if the data gathering were extended. This involves extrapolation. Extrapolation is generally much less reliable than interpolation because there can be no guarantee that previous trends will continue beyond the known period.
Once students have answered question 2 in pairs, have them discuss their answers with another pair of students and, where there is disagreement, encourage data-based disputation, with the aim of reaching an agreed position.
Investigation
For this investigation, the students need to have a clear understanding of the PPDAC.
Encourage the students to use statistical language in their analyses and their onclusions. They should be gaining confi dence in using words such as theory, investigate, data, justify, predict, ratio, distribution, middle, range, spread, cluster, outlier, frequent, sample, scatter plot, random, relatively, generalisation, systematic, biased, selection, bivariate.
Answers to Activity
1.
This is the best type of graph to use because it clearly shows the progress of the beans in relation to each other and, for any day, you can compare their heights by referring to the vertical axis.
2. Discussion will vary. Possible points include:
i. The GrowSmart beans do grow better than the other two, but not more steadily. In
fact, all four beans grow at a similar rate and have a similar pattern of plateaux and
spurts. This is particularly true from day 10 onwards: GS1 gets away to an excellent
start and manages to hold but not increase its lead.
ii. True. GS1 appears above ground 2 days earlier and quickly gains a lead. It
maintains a lead of 8–10 cm for almost the entire period of the experiment, although
the gap appears to be closing over the last 4 days.
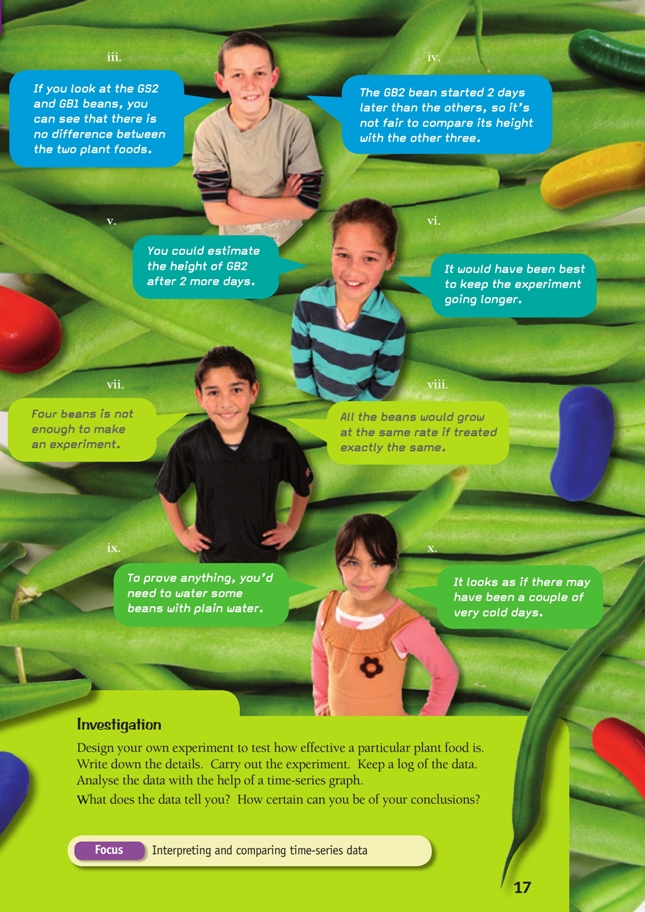
iii. While these two beans do follow a very similar growth pattern (they keep
swapping second and third position), it is not fair to ignore the other two when
making a generalisation about the plant foods. (If a generalisation were based on
just GS1 and GB2, it would strongly favour GrowSmart.)
iv. It is true that GB2 appears above ground 2 days later than the others, but this is fair in terms of the experiment, which measures growth from the time of planting.
v. Yes, you could. You could do the same for the other three beans, too, as all four
are following a reasonably predictable growth path. Reasonable estimates (based
on growth over the previous 4 days) would be GS1 38 cm, GS2 36 cm, GB1
33 cm, and GB2 33 cm.
vi. True. A longer experiment would have revealed, for example, if GS2’s growth
rate continued to exceed GB1’s. It would also have shown if GS1’s growth was
slowing down.
vii. This is a fair comment, especially as factors other than the plant food will affect
growth (for example, soil and the fertility of the individual beans).
viii. False. The beans within each pair in this experiment do not grow exactly the same even though they apparently receive the same treatment. It is difficult to ensure
truly identical conditions and treatment. And like people, beans have their own
individual characteristics.
ix. True. It may be that the beans would have grown just as well if they had been
given just water.
x. Possibly true. It looks as if conditions are particularly favourable between days 10
and 12, as all four beans grow rapidly. But between days 12 and 14, they hardly grow at all. This suggests a couple of cold days.
Investigation
Experiments, conclusions, and discussion will vary. It might be useful to combine your results with those of other classmates who are using the same plant food as you. This will not guarantee your conclusions but may show some patterns, depending on how
long you run your experiment for.
Key Competencies
Bean There can be used to develop these key competencies:
• thinking
• relating to others.