This is a level 3 statistics activity from the Figure It Out series.
conduct a survey
collate survey data
create a graph
interpret findings
This diagram shows the areas of Statistics involved in this activity.
.gif)
The bottom half of the diagram represents the 5 stages of the PPDAC (Problem, Plan, Data, Analysis, Conclusion) statistics investigation cycle.
Statistical Ideas
Ad Appeal! involves the following statistical ideas: using data cards to collect multivariate data, sorting and re-sorting data, making sense of data, and using two-way tables of counts.
Magazines (with colourful advertisements)
A frequency table (see copymaster)
FIO, Levels 3+ -4, Statistics in the Media, Ad Appeal! pages 14-15
Classmates
Activity One
Data cards contain multivariate data relating to a single person. Data cards are easy to manipulate and collate in different ways. When your students are using data cards, encourage them to group and regroup the data according to different variables. Cards can be stacked above or beside each other to make a bar or strip graph for a quick and easy data display. Students should be able to ask and answer comparison questions using the data cards.
If you use paper card that matches each colour being used (be creative with the colour black …), this will help the students to make a quick association and will aid in generating an effective data display. If this option is unavailable, use white card and have students colour the relevant segment in the colour being surveyed.
For question 2, the students may need help in finding categories for sorting the data (see the example for green in the students’ book). This “making sense of the data” is a key learning experience because real data does not always fall into easy categories. Some widely shared associations may relate to well-known brands that the students are familiar with.
Extension
The physical manipulation of the data cards will help the students to ask and answer their own investigative questions, for example, “Do older students tend to have more abstract colour associations than younger students?”
When students present their findings, encourage them to critique and evaluate the effectiveness of their chosen displays. Some students may want to use the actual data cards in their displays.
Activity Two
This activity could be done as a class survey, but extending it to other classes will give the students a larger pool of data to work with. (If they manage to get 100 responses, the percentages will be easy!) When the students are analysing the results, they should look at the cells with the most tally marks as well as at the column totals. If both point towards the same combination of header and pitch, the choice is clear. When the students are communicating findings, they should give results in terms of the number of votes (as done in the Answers).
Answers
Activity One
1. Survey results and overall headings will vary. At the collation stage, you could sort the data cards physically rather than rewriting the information in a table. After you have put the data into groups by initial association, it is useful to make a table such as this one: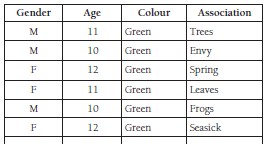
and then break it down further into similar associations, such as: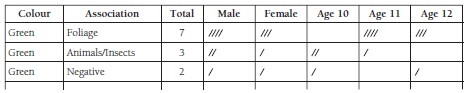
(By including age again, you can discuss any differences.)
2. a. Comments will vary. For example, you might find that there is very little difference in what people think about the
different colours, or you might find that everyone has a different idea about a colour. For those associations that are
widely shared, it might be because the colour is associated with something that is very familiar or is a widely held notion,
for example, the association of blue with sky. Opinions about the reasons for differences will vary.
b. Answers will vary. Girls and boys may have different interests that relate to their associations of colour.
3. a. Graphs (for example, bar or strip graphs) and statements will vary.
b. The findings might help advertisers assess whether the colours used in their ads are going to appeal to potential buyers or users or encourage them to associate a particular colour with a product or service.
Activity Two
1. Survey results and tally charts will vary.
2. a. Tables will vary depending on survey results. Over the page is an example of a table summarising the results from a class survey.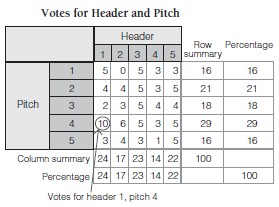
i. In this example, header 1 is most popular, followed by header 3. A possible graph is: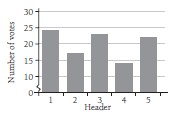
ii. In this example, pitch 4 is most popular, followed by pitch 2. A possible graph is: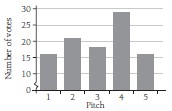
iii. In this example, header 1, pitch 4 is the most popular combination. (In your survey, two or more options could be very close.)
b. Recommendations and reasons will vary, but they should be supported by results from the survey data. You and your
classmates will be using your own school’s data, so progress towards agreement should be possible. (The class may need to undertake a further survey, based perhaps on the 3 or 4 most popular recommendations.)