Session 1: Getting our travel data
PROBLEM: Generating ideas for statistical investigation and developing investigative questions
We are going to explore daily travel to school.
- Discuss what information the class could collect about their daily travel to school. Collect ideas on the board.
- For each idea, identify potential variables that they could “measure”, e.g., method of travel; number of passengers per vehicle; time to travel to school; distance travelled to school; number of traffic lights/roundabouts/stop signs between their house and school.
- For each potential variable identify if it is categorical or numerical. For numerical variables identify if they are discrete (counted) or continuous (measurement).
- In groups select an idea/variable to explore further. Each group should have a different idea/variable.
- As a group the students interrogate their ideas/variable by answering the following questions:
- Is this an area that the students in our class would be happy to share information with everyone? If not reject the idea [ethics] (refer criteria 4).
- Can we collect data to answer an investigative question based on this area of interest? If not reject the idea [ability to gather data to answer the investigative question] (refer criteria 4).
- What would be the purpose of asking about the idea that you have? Do you think it will provide meaningful information about our topic on daily travel to school? How might the information be used to improve people's lives? If it is not purposeful then reject the idea [purposeful or interesting] (refer criteria 5).
- Would the investigative question that we pose to explore the idea involve everyone in the class? If not, then reject the idea [involving the whole group] (refer criteria 6).
If the students end up rejecting their idea, they select a new one and repeat the process.
- Each group develops an investigative question to explore their idea/variable. To help them get started, ask the groups to identify what the variable is (this is what we want to measure, refer criteria 1) and to describe the group (this is who we will measure, the group is likely to be “our class”, refer criteria 2).
- Groups to interrogate their investigative questions by asking the following questions:
- Is the variable clear? (refer criteria 1)
- Is the group we are investigating clear? (refer criteria 2)
- Is the question purposeful? (refer criteria 5)
- Is the question about the whole group? Check that the question is not just finding out about an individual or smaller group of the whole class (refer criteria 6).
- Is the question one that we can collect data for? (refer criteria 4)
- Is it clear whether the question is a summary investigative question (about a single variable) or a comparison investigative question (a single variable compared across two or more groups)? (refer criteria 3)
Session 2: Planning to collect travel data
PLAN: Planning to collect data to answer our investigative question
- Each group decides how they will collect their data by defining the variable and working out how to measure it so that they get valid and reliable measures. They develop survey questions to ask the class. Roam and support each group. Consider planning the different groups to include a mix of more knowledgeable and less knowledgeable students to encourage tukana-teina. Students may also benefit from being provided with a graphic organiser that can be used to develop and refine their plan.
- Groups interrogate their plan using the following interrogative questions:
- Can a single measurement capture the ideas needed to answer the investigative question?
- Is there a usual way of measuring this variable?
- Does this measurement really capture the variable I want to measure (validity)?
- If I were to measure the same units again, would I get very similar results (reliability)?
- If different people were to make the same measurement will they get very similar results (reliability)?
- Do I have the equipment to make this measure?
- Groups update their plan as required.
- Groups decide on how they are going to record their data. If appropriate, encourage the use of digital tools such as Google Sheets or Microsoft Excel.
- As a class you might decide to use a Google form (or similar) to collect the data. Encourage your class to consider the sample they are collecting data from, and how appropriate the use of digital technology will be for these people.
- Make sure that a survey question about method of travel to school and time taken to travel to school are included if none of the groups have chosen to do these. The survey questions from the CensusAtSchool questionnaire are recommended for use. The survey questions are:
What is the main way you usually travel to school? (Choice from) walk | car | bus | train | bike | boat | scooter | other
How long does it usually take you to get to school? Answer to the nearest minute.
___________ minutes
DATA: Collecting and organising data
- The groups share their survey questions that they will use to collect data from the class at the next session. Any data that requires students to take an action to be able to give a response the next time needs to be highlighted. For example, if students are required to know how long it takes to get to school, they need to know this so that the next day they can be conscious of recording the time taken to get to school.
Session 3: Collecting and organising our travel data
In this session the students will be using an online tool for data analysis. One suggested free online tool is CODAP. Feel free to use other tools you are familiar with. This session is written with CODAP as the online tool and is assuming students are familiar with CODAP.
If your students are unfamiliar with CODAP see:
The main features that students need to be familiar with are how to draw a graph and how to import their data. More on importing data into CODAP can be found here.
- Allow students time to collect their data for their survey questions.
- It is possible that a single spreadsheet could be set up and the students individually put their data into the spreadsheet for each of the survey questions. Make sure the spreadsheet is saved in CSV (Comma Separated Variable) so it can be imported into CODAP or other graphing tools.
- A Google form (or similar) could be created for all the survey questions and the students complete this.
- Alternatively, students create a paper table to collect the data into and then input this into an electronic spreadsheet.
The aim is to have the data in an electronic form so they can use technology to make the displays.
ANALYSIS: Using an online tool to make data displays
- Share the spreadsheet with the students (if they do not already have access). This should be shared as a .csv file.
- Students import the data into CODAP (see here for information on how to do this).
- Students explore different ways in CODAP to graph their data to answer their investigative question.
- Students present their graph to the rest of the class. This could be through showing their CODAP working document. They could also be given time to create a digital presentation using Microsoft PowerPoint, Google Slides, Canva, or Microsoft Word.
- As each graph is presented, ask the students what “they notice…” about the data. Encourage groups to add the “I notice…” statements to their display.
- In CODAP they can write I notice statements using a text box.
- On a Google slide/PowerPoint, Word/Google doc they can type the "I notice...." statements below the graph.
- Get the students to share their graphs and statements with you and their classmates. Find the method of travel graph and the time taken to travel to school graph and have it ready for the next session. If no groups chose these variables, make the graphs ready for the next session.
- Ask the students what they notice about the graphs for the different types of variables. For example, how does a graph of categorical data compare to a graph of numerical data?
- Homework activity for students: In a couple of sessions we will compare how we travel to school with how our parents and caregivers travelled to school. Overnight can you ask your parents and caregivers the following two survey questions (Copymaster 1):
- What was the main way you usually travelled to school when you were my age? (Choose from) walk | car | bus | train | bike | boat | scooter | other__________
If they select "other", record how they travelled to school. - How long did it take you to travel to school (your best guess) in minutes?
Session 4: Making comparisons
- Before the lesson, set up a Google form or similar to collect the data obtained from the students about their parents and caregivers that they filled in overnight. Students who have shown a high level of proficiency and understanding in the learning prior to this session could be tasked with creating this survey. Ensure that you check the survey before sending it out to whānau.
- Ask the students to complete the two-question survey with the data from their parents and caregivers.
- Collect in their sheets (so you can check data input if needed).
- In preparation for session 5, download the parent and caregiver data and import into a CODAP file. Share the CODAP file with your students.
How do we compare with other New Zealanders our age?
- Students from around New Zealand have also been asked how they travel to school, and the time taken to travel to school. This data has been collected and is available on the CensusAtSchool site.
In this session students will get their own sample of students their age from the CensusAtSchool database to compare with the class data from the previous sessions for these two variables.
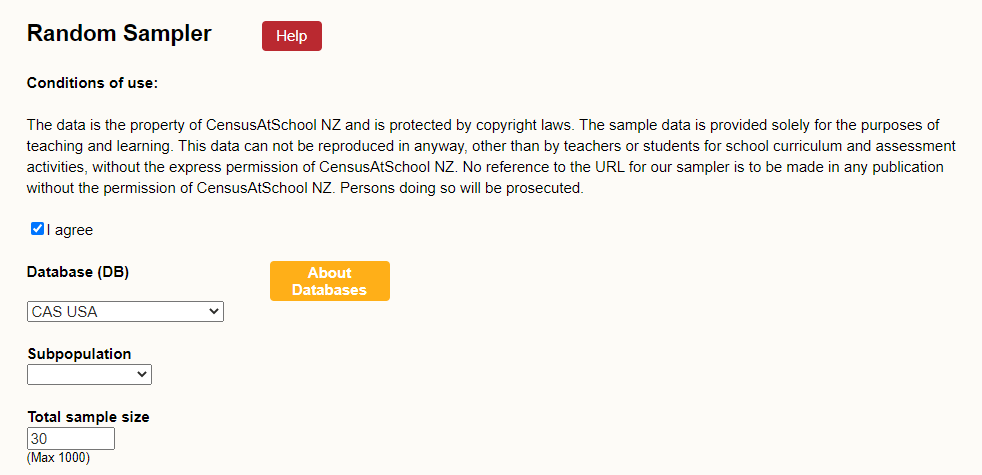
Show students the CensusAtSchool random sampler, remembering to accept the conditions of use. Once in there, familiarise the students with the tool. There are five parts to the tool.- Select database – here we can choose any database from 2005 onwards. Recommend they use the latest database (this is the pre-selected option).
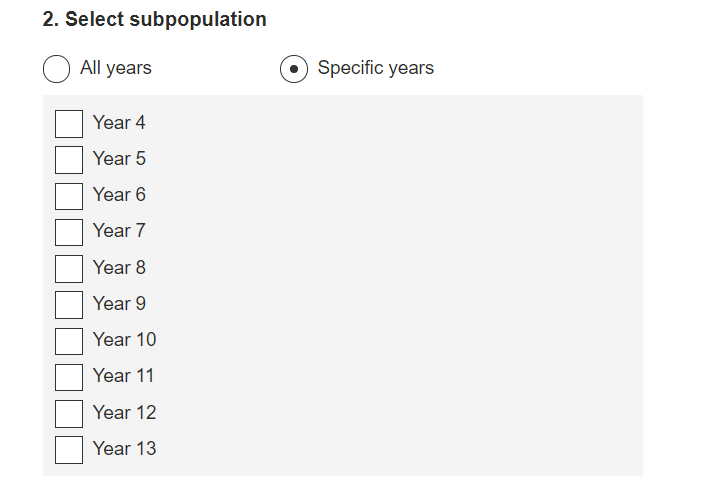
- Select subpopulation – because we want to compare with other New Zealanders our age, we want to select specific years. When we select specific years, we get a drop-down list that allows us to select the same year level as the students. Select the year level.
- Select variables – because we want to look at method of travel and travel time to school, we only want to select specific variables. When we select specific variable, we get a drop-down list of all the variables in the survey.
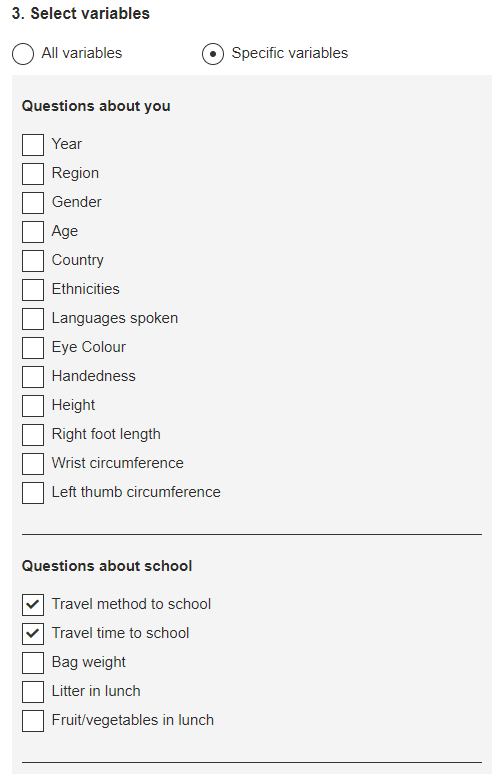
Ask the students which variables we should select if we want to compare with our class data about "method of travel to school" and "time taken to get to school". Select these two variables. - Select sample type – leave as random sample
- Enter sample size (Maximum 1000) – suggest they select 30 as this is similar in size to a class.
- Once they have made the selections in the five parts, students click on "generate sample" and download the sample to their desktop.
- Students save the .csv file and then import into CODAP. (The video here shows how to import data from CensusAtSchool.)
- Once the data has been collected from the site, ask the students to discuss how they might make a comparison with their own data.
- Students display the data for the two variables using CODAP (Their data and that of the sample students). They should write “I notice” statements about what they see in their data from CensusAtSchool.
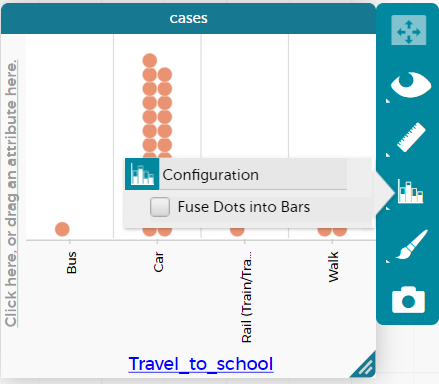
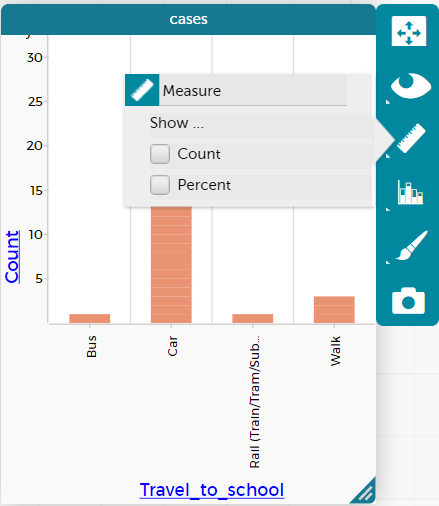
- If students have not yet learnt how to convert the categorical data into a bar graph show them how to do this. Select the graph and the tool bar comes up. Select the bar graph icon and select fuse dots into bars. Students can then select the ruler and choose percent. This will show the percentage in each bar allowing for comparisons between data sets of different sizes more easily.
- Ask the students how they might compare the numerical data. For example, having the same scale on the x-axis is important to help with visual comparisons.
- Students then compare their CensusAtSchool sample with the class data noticing what is similar and what is different.
Note: If the students have all downloaded their own individual samples from CensusAtSchool the discussions each student makes could be quite different. If you want them all to have the same sample from CensusAtSchool you can download a sample yourself, import into CODAP and then share the CODAP document with your students (see this video on saving and sharing CODAP documents). - Reflect on which of the data types (categorical or numerical) was easiest to compare and why.
How do we compare with the USA?
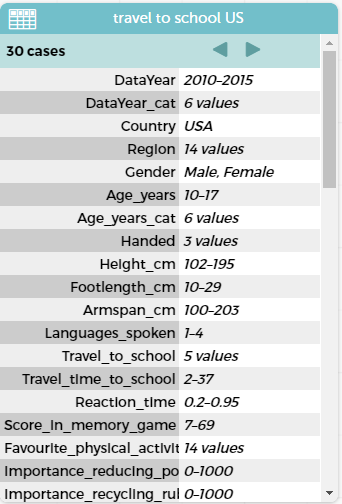
- Other students from around the world have also been asked how they travel to school. For example, the USA. The USA data is available at this link.
- As with the New Zealand data, confirm the conditions of use
- Select the CAS USA database
- Make the total sample size 30
- Download and save
- Import into CODAP
Note: the filters might not be working on the USA database, therefore it might not be possible to get an age appropriate data set. Including all ages should be fine for the comparison ideas for the travel to school.
- Once the data has been collected from the site, get the students to discuss how they might make a comparison with their own data.
What do they notice is different about this data set compared with the one we did for the New Zealand data? We have all of the variables in the USA data set whereas in the New Zealand data set we just had the two variables we wanted to explore.
Which variables do we want to graph from this data set to compare with our class data and the New Zealand data? Students can convert the data from a table view to a case card view (in CODAP), this makes it easier to see the variables. Students identify that travel_to_school and travel_time_to_school are the variables we are interested in.
- Conclude with a reporting time where the students are given the chance to show their graphs and to discuss what they have found out. They will probably have compared each mode of travel between the three sets of data and the time taken to get to school between three sets of data. Can they give reasons for any differences they have found?
Session 5: Has the method of travel to school changed?
- Explain that today we will look at how our parents and caregivers traveled to school. Ask the students to predict what they think will be the same as our class and what will be different. Capture the ideas on the board or a large sheet of paper.
- Share the parents and caregivers’ data set with the students (share the CODAP document).
- Get the students to make displays and discuss how the data set is the same and different from the class data and then compare with the New Zealand sample and the USA sample.
- What conclusions have they reached? What factors mean that this may not be a totally valid comparison? (e.g., the differing ages of the parents and caregivers, the fact that parents and caregivers may not have lived in this area when they were young, etc).
CONCLUSION: Answering the investigative question and reporting findings
- Students develop a short report to share with their parents and caregivers that compares the class data with the parents and caregivers’ data.
Additional related exploration
Exploring across five countries
Using the old random sampler https://new.censusatschool.org.nz/tools/random-sampler/ on CensusAtSchool, students can select the CAS international database. If they select subpopulation and then country, boxes will show so they can select 30 from each country.
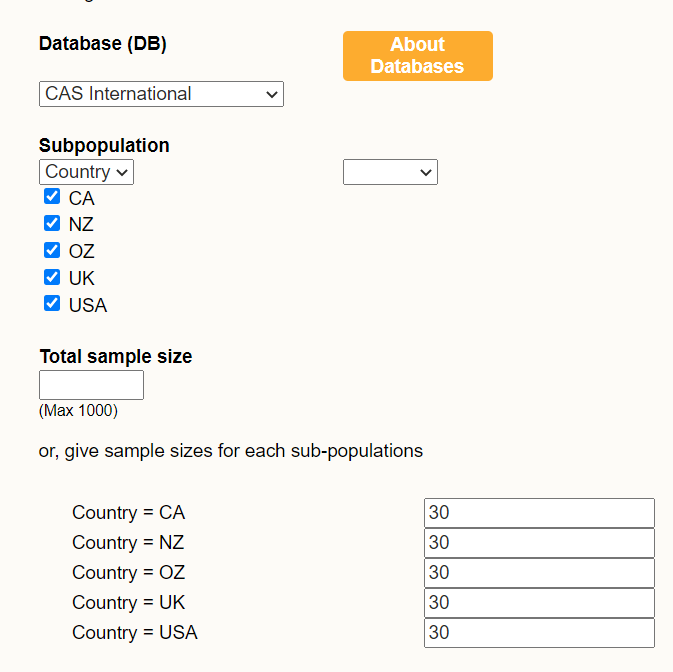
They can download the sample and import into CODAP to explore.
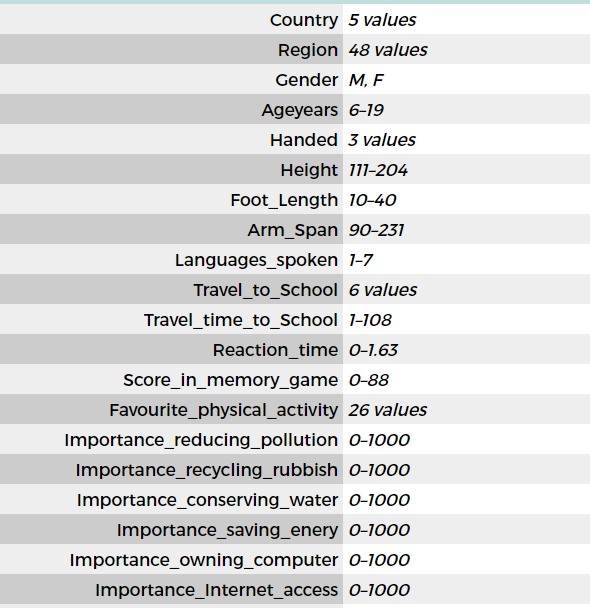
The data set contains 20 variables, two of which are the travel variables we have been looking at.
Encourage students to explore the full data set using CODAP and develop their graphing and describing skills.
Data cards: Level 2
This unit introduces the students to a way of looking at information from a group of individuals, i.e. a data set.
A "data card" is simply a square piece of paper containing information about an individual person or thing. At this level, the data card is divided into three areas with the same category information in the same location on each card. In this unit, the terms data and information are used to mean the same thing and are interchanged throughout. Because several pieces of information about individuals are on each data card, different categories can be looked at simply by rearranging the cards.
This unit focuses on sorting and organising data sets, i.e. collections of information from a group of individuals. As the data set is looked at, questions or interesting things arise. This is different from starting with an investigative question then collecting data to answer the investigative question.
Understanding the difference between individual data and group data is central to the unit. The goal is to move students from “that is Jo’s data and that is me” to making statements about the group in general. Increasing students' ability to accurately describe aspects of a data set, including developing statistical vocabulary, is part of the unit. As students become comfortable with making statements and describing data, more precise vocabulary is to be encouraged. The meaning and usage of words like; same, similar, exactly and almost need to be explored during the unit along with the importance of using numerical descriptions, e.g. 2 more than, when describing or comparing data.
Investigative questions
At Level 2 students should be generating broad ideas to investigate and the teacher works with the students to refine their ideas into an investigative question that can be answered with data. Investigative summary questions are about the class or other whole group. The variables are categorical or whole numbers. Investigative questions are the questions we ask of the data.
The investigative question development is led by the teacher, and through questioning of the students, identifies the variable of interest and the group the investigative question is about. The teacher still forms the investigative question but with student input.
Data collection or survey questions
Data collection or survey questions are the questions we ask to collect the data to answer the investigative question. For example, if our investigative question was; “What native birds do the students in our class like?” a corresponding data collection or survey question might be “What is your favourite native bird?”
As with the investigative question, data collection or survey question development is led by the teacher, and through questioning of the students, suitable data collection or survey questions are developed.
The learning opportunities in this unit can be differentiated by providing or removing support to students and by varying the task requirements. Ways to support students include:
The context for this unit can be adapted to suit the interests and experiences of your students. This can happen easily in Session 4 and 5.
The te reo Māori vocabulary term pātai (question) could be introduced in this unit and used throughout other mathematical learning.
pīwakawaka, tūī or kererū?
Session One
What could “tūī” mean? What could “reading” mean? What could “Even date” mean?
Does anyone in the class fit this data card?
Do you know someone that fits this data card that is not in this class?
How many different people could this data card be correct for?
What would a data card about you look like?
Session Two
Initially encourage the students to look at one category at a time then, encourage students to look for categories within other categories, e.g. What favourite subject (reading, writing or maths) is most popular with students who like tūī?
Session Three
What do you think we will find out about our class?
Will it be mainly different or similar to the group looked at in Session Two?
Session Four
Today the students, in pairs (tuakana/teina model could work well here), will design and collect their own data using data cards. Each pair of students needs to design three data collection questions to ask other students in the class.
Sample data collection questions:
Session Five
In pairs the students are to sort and organise their data cards to look for other interesting things about the class and to see if the statements they made about the class were correct.
After a set time each pair reports what they found out about the class. This could be in the form of a written report with some sentences about what they found out, a conference with their teacher or an oral presentation to the class.
Dear whānau,
At school we have been learning about data collection. You could support your child to write 3-4 questions to survey your whānau on. These questions should have a ‘yes’ or ‘no’ answer or 2-3 options for an answer. For example, What is your favourite native bird - kererū, tūī or pīwakawaka? Ask your child to say or write some concluding statements about the data s/he collects. For example, All the people in my whānau like tūī.
Travel to school
In this unit students investigate methods of travel to school, using technology to produce data displays and investigate distributions.
Arnold’s (2013) research identified six criteria for what makes a good investigative question. At curriculum level 4, students should be introduced to the criteria, potentially through “discovering” them. See for example, the following lesson on CensusAtSchool New Zealand https://new.censusatschool.org.nz/resource/posing-summary-investigative-questions/ .
The six criteria are:
Categorical variables
Categorical variables come from classifying individuals or objects into categories. For example, the method of travel to school, colour of eyes, iwi, birthplace, etc.
Numerical variables
Numerical variables include variables that are measured, e.g., the time taken to travel to school, and variables that are counted e.g. the number of traffic lights between home and school. Measured numerical variables are called continuous numerical variables. Counted numerical variables are called discrete numerical variables.
Measures
We “measure” both categorical and numerical variables. For example, if we were to ask about how students carry their school bag, we would have to decide what categories we will offer as options for carrying a school bag. Fortunately, this is one of the survey questions from CensusAtSchool so we can use their wording. Additionally, if we want to measure the distance from our house to school, we need to plan to help students work this out. For example, we might choose to map on google maps and take the distance from google maps.
Key to deciding about measures is to support getting valid and reliable measures. Valid measurements measure what they claim to measure, and reliable measurements are those that give you or someone else approximately the same result time after time when taken on the same individual or object. For example, using Google Maps to find the distance from home to school is both valid and reliable. It measures the distance from home to school (validity) and we will get the same result regardless of if the student or someone else was to get the information from google maps (reliability).
The learning opportunities in this unit can be differentiated by providing or removing support to students and by varying the task requirements. Ways to support students include:
The context for this unit can be adapted to suit the interests and experiences of your students. For example:
Te reo Māori vocabulary terms such as mehua (measure), tauanga (statistics), pātai (question), tirohanga tauanga (statistical survey), tūhura (investigate/investigation), kohikohi raraunga (data collection), raraunga (data), and taurangi (variable) could be introduced in this unit and used throughout other mathematical learning.
Session 1: Getting our travel data
PROBLEM: Generating ideas for statistical investigation and developing investigative questions
We are going to explore daily travel to school.
If the students end up rejecting their idea, they select a new one and repeat the process.
Session 2: Planning to collect travel data
PLAN: Planning to collect data to answer our investigative question
What is the main way you usually travel to school? (Choice from) walk | car | bus | train | bike | boat | scooter | other
How long does it usually take you to get to school? Answer to the nearest minute.
___________ minutes
DATA: Collecting and organising data
Session 3: Collecting and organising our travel data
In this session the students will be using an online tool for data analysis. One suggested free online tool is CODAP. Feel free to use other tools you are familiar with. This session is written with CODAP as the online tool and is assuming students are familiar with CODAP.
If your students are unfamiliar with CODAP see:
The main features that students need to be familiar with are how to draw a graph and how to import their data. More on importing data into CODAP can be found here.
The aim is to have the data in an electronic form so they can use technology to make the displays.
ANALYSIS: Using an online tool to make data displays
If they select "other", record how they travelled to school.
Session 4: Making comparisons
How do we compare with other New Zealanders our age?
In this session students will get their own sample of students their age from the CensusAtSchool database to compare with the class data from the previous sessions for these two variables.
Show students the CensusAtSchool random sampler, remembering to accept the conditions of use. Once in there, familiarise the students with the tool. There are five parts to the tool.
Ask the students which variables we should select if we want to compare with our class data about "method of travel to school" and "time taken to get to school". Select these two variables.
Note: If the students have all downloaded their own individual samples from CensusAtSchool the discussions each student makes could be quite different. If you want them all to have the same sample from CensusAtSchool you can download a sample yourself, import into CODAP and then share the CODAP document with your students (see this video on saving and sharing CODAP documents).
How do we compare with the USA?
Note: the filters might not be working on the USA database, therefore it might not be possible to get an age appropriate data set. Including all ages should be fine for the comparison ideas for the travel to school.
What do they notice is different about this data set compared with the one we did for the New Zealand data? We have all of the variables in the USA data set whereas in the New Zealand data set we just had the two variables we wanted to explore.
Which variables do we want to graph from this data set to compare with our class data and the New Zealand data? Students can convert the data from a table view to a case card view (in CODAP), this makes it easier to see the variables. Students identify that travel_to_school and travel_time_to_school are the variables we are interested in.
Session 5: Has the method of travel to school changed?
CONCLUSION: Answering the investigative question and reporting findings
Additional related exploration
Exploring across five countries
Using the old random sampler https://new.censusatschool.org.nz/tools/random-sampler/ on CensusAtSchool, students can select the CAS international database. If they select subpopulation and then country, boxes will show so they can select 30 from each country.
They can download the sample and import into CODAP to explore.
The data set contains 20 variables, two of which are the travel variables we have been looking at.
Encourage students to explore the full data set using CODAP and develop their graphing and describing skills.
Figure it Out Links
Some links from the Figure It Out series which you may find useful are: