In this practical unit students make ramps, roll marbles down them, record the distance the marble travels from different starting positions, graph these distances, predict other distances, and make statements based on the data they create.
- Construct a stable ramp to meet conditions.
- Follow and repeat a procedure to replicate exactly the same conditions (fair testing).
- Measure and record distances accurately.
- Graph the starting positions and distances traveled on scatter graphs.
- Talk about distinctive features of scatter graphs.
- Make statements, backed up by reference to graphs, about possible actions.
Scatter graphs are introduced in this unit. To understand scatter graphs students need to comprehend the relationship between the horizontal and vertical axes, i.e. the x-axis and y-axis. They also need to perceive how one mark on a graph displays the related values for two variables. A standard convention is to represent the independent, or explanatory, variable on the x-axis. The dependent, or response, variable is represented on the y-axis. A given point, say (30, 22), represents a single occurrence such as a marble released from a height of 30cm (the independent variable) that rolls for 22cm on the carpet (the dependent variable). A collection of single instances is represented by a collection of points on a scatter graph.
Making predictions based on information from graphs and from student’s own experimenting is a feature of this unit. The nature of predicting, the risks of predicting based on a small number of trials, handling unexpected results, looking for patterns and trends and making sense of the results are all important areas of learning that are covered in this unit. They may require additional teaching depending on the needs of your students.
The practical nature of the activities will make the unit accessible to most students. The learning opportunities in this unit can be differentiated by providing or removing support to students, or by varying the task requirements. Ways to support students include:
- scaffolding the steps of an investigation in a diagram to support some students to work through the process
- limiting the variables being investigated, e.g. relate only angle and roll length
- explicitly modelling the measuring of lengths and the drawing of scatter graphs through an ‘I do, we do, you do’ approach. Draw attention to ordered pairs as representing one trial within a big experiment
- using graphing technology to support students in efficient graph construction.
The context of the unit, marble rolling, is a contrived setting. There are numerous implications of the experiment for everyday life. Relate the rolling of a ball to launching a waka, riding a bicycle, or driving a car (downhill).
As you go faster how much harder is it for you to stop?
How does the surface alter your stopping distance? Is it easier to stop your bicycle going downhill on a dry road, or a wet road? …on concrete or on gravel or sand? Why?
These discussions might lead to a broader investigation of safety related to moving bodies. For example:
Why are rock falls, avalanches and lahars (mudflows from a volcano) so dangerous? This could be related to learning about rock falls after earthquakes or severe rainfall, avalanches in the Southern Alps and the Tangiwai Train Disaster 1953 when a volcanic lahar erupted.
If a runaway sheep is racing downhill, should you try to stop it?
Te reo Maori vocabulary terms such as poi (sphere), mita rūri (metre ruler), mitamano (millimetres), mitarau (centimetres) and kauwhata marara (scatter graphs) could be introduced in this unit and used throughout other mathematical learning.
- Material to raise one end of the ramp, e.g. books, bricks, blocks of wood
- Instrument to measure distances, i.e. ruler or tape measure
- Protractors (old wooden blackboard style are excellent)
- Material to make a stable ramp, e.g. wooden metre rulers with a central groove, long cardboard tubes from material, polythene rolls, plastic tubing, lengths of recycled guttering
- Marbles of different sizes (from dollar shops or toy outlets)
- Paper and pencil
- Copymaster 1: Scatter Graph - Blank
- Copymaster 2: Scatter Graph Samples
- Optional: Access to devices with graphing software installed (e.g. Google Sheets, Microsoft Excel)
Session One
During this session students make ramps, roll marbles down the ramps, and record the distance the marbles travel. The creation of ramps in this session could be linked to procedural writing. Videos of world record marble run attempts can be found online, and could be used to ignite interest in this context.
- Show an online video of a spherical object rolling downhill. Search for “History of Zorbing.” The Zorb was invented by New Zealanders.
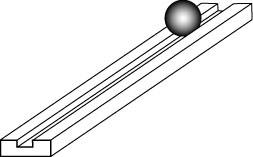
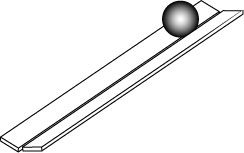
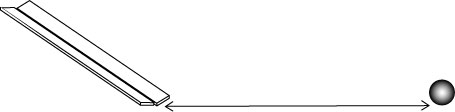
- Tell the students that they will investigate what happens when a sphere is rolled down a slope. Organise the students into pairs and have them make a stable ramp. The ramp could be made using a single wooden metre ruler with a groove down the middle of it. Otherwise, a ramp could be created by joining together two metre rulers, long cardboard tubes (fabric outlets are good for these), plastic tubing, recycled plastic guttering, or other suitable material. The ramp needs to remain consistent throughout the session, with only the elevation being altered. Place one end of the ramp on books to make a slope and the other end positioned to allow the marble to roll until it stops without hitting anything. Some experimentation will be needed to get an appropriate height and position to allow the marble to roll freely to a stop. A carpeted surface is better at this point than wood, concrete, or linoleum.
- Once a stable ramp has been made and tested, ask the students to record the features of their ramp so it can be put away, and rebuilt in exactly the same way in later sessions. Digital photographs might be taken as a record of the setup.
- Demonstrate rolling a marble down one of the ramps. Tease out the idea of fairness in testing. For example, the roller should have no influence on the marble so releasing rather than dropping the marble at the top of the run is kept consistent.
- Show how the distance from the end of the ramp to the resting place of the marble is measured and recorded.
What unit of measure is best? (centimetres may not be accurate enough so millimetres might be used).
What is the best way to record the results? (Creating a table on a digital platform will allow for quick display and analysis of the data). - Each pair of students needs to create a sample of 20 rolls and to record the data.
- Time might permit looking at the sample data.
Why does the marble stop? (Discuss friction).
Did the marble roll the same distance each time? (Unlikely).
Why did the distance vary? (Consider factors like marble release, variations in the surface of the run and carpet floor, dust on the marble or run, interference from movement or wind, or any other factors that might cause variation).
What is the best way to get a measure of ‘usual’ run from the top of the run? (Students might suggest finding an average or simply recording the range. Some distances might be removed as they are outliers). - Once completed, pack the ramp and marbles away, reminding the students that they will need to set up their ramps in exactly the same way for the next session. They should use the information they previously recorded in step 3, as well as any additional notes they think will be useful. Make sure students save the 20 distances they recorded.
Session Two
- Direct the students to rebuild their ramp in exactly the same way as it was in Session One. Once the ramps are completed, students should use the same marble used in Session One. With the class, discuss the following questions:
Will the starting point of the marble make any difference to the distance the marble travels?
Students should expect that the marble will roll further if released from higher on the ramp.
Why will the marble roll further when released further up?
Students will have ideas about why variation in distance occurs. Avoid giving the scientific explanation. The higher the point that the marble is released from, the greater is its potential energy. That energy converts to greater speed when the end of the ramp is reached. Friction takes longer to slow a faster marble to a stop. - Set up the following experiment.
Release a marble from each of the five starting positions, listed below. Carry out five trials (marble releases) from each starting position. Record the distance travelled from the end of the ramp for each trial. For each experiment, encourage students to predict what might happen.- Task 1: Roll the marble from the top of the ramp (release height is 100 cm from the bottom of the ramp)
Start the marble at the top of the ramp and record the distance it travels from the bottom of the ramp. - Task 2: Start 90 cm from the bottom of the ramp, i.e., 10 centimetres from the top of the ramp.
- Task 3: Start 80 cm from the bottom of the ramp, i.e., 20 cm from the top of the ramp.
- Task 4: Start 20 cm from the bottom of the ramp, i.e., 80 cm from the top
- Task 5: Start 10 cm from the bottom of the ramp, i.e., 90 cm from the top.
- Task 1: Roll the marble from the top of the ramp (release height is 100 cm from the bottom of the ramp)
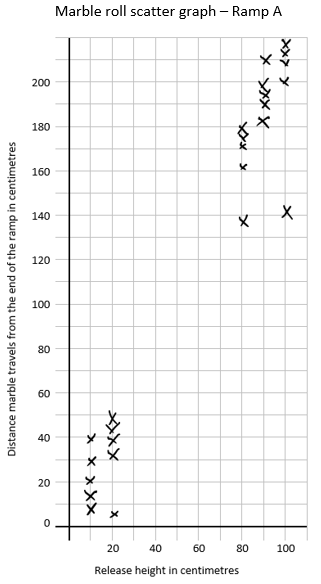
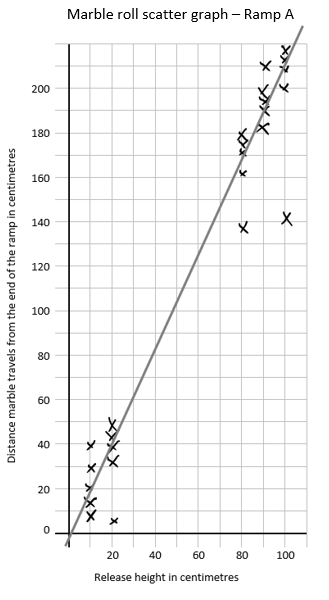
- Ask the students to leave the ramps in place and shift their focus to the recording of the distances onto a scatter graph. Explain to the class what a scatter graph is and how the two axes are used to show the release height and the distance rolled using a single cross or dot. Show the students how this completed scatter graph is created, using Copymaster One, or a digital graphing package such as Excel or Google sheets.
- Ask the students:
Could this graph be helpful in predicting other starting positions?
What distance would the marble travel if the release height was 50 cm? - Discuss the distinctive features of the above graph:
- the distances that do not follow the pattern, i.e. outliers
- the clusters or groupings of the distances starting from the same place
- the overall pattern or trend of the data, i.e., a straight line or a curve
- other pattern or trends that could be possible
- maximum and minimum distances
Create a class chart or record of these points. During discussion, add to the chart as the graph features are identified. This could be digital or hard-copy.
- Hand out a blank scatter graph for the students to use to display the data from their trials for today. Explain that it is a convention of mathematics that the independent variable is represented on the x-axis, and the dependent variable is represented on the y-axis. In this context, you (or the students) are controlling the height the marble is released from. Therefore, this is the independent variable (represented on the x-axis) because it can be manipulated by the researchers (i.e. you or the students). The distance that the marble travels is the dependent variable (y-axis) because it occurs as a result of how you have modified the independent variable. In other terms, the release height (independent variable) affects the distance that the marble travels (dependent variable).
- Ask the students to look at their own scatter graphs and predict the distance the marble will travel when started 40 cm, 50 cm and 60 cm from the bottom of the ramp. Before rolling the marble on their ramps, have each pair explain, or write down, why they think it will roll the distances they have predicted.
- After making their predictions, students can roll the marble down their ramp at the various starting points. Record the rolling distances. Discuss these results and compare the data to their predictions.
How did you use the data from your trials to make predictions? (Students should reveal an understanding of a trendline) - If time allows, repeat the same experiment using a larger marble.
Do you expect the same results or something different? Why? - Discuss the implications of these findings for real life rolling objects. What could we compare the action of the marble to? Make connections to your local area (e.g. a soccer ball rolling down a hill in the playground, walking down a steep street, skiing on a steeper slope) and/or to other relevant learning (e.g. around natural disasters).
- Pack up the ramps and marbles reminding the students they will need to use the ramps again during Session Four.
Session Three
This session has the students looking at a range of scatter graphs of data from marble rolling, with the task of predicting distances the marble is likely to roll. The discussion about making sense and using information from scatter graphs started in Session Two continues and is developed during this session.
There are six scatter graphs for the students to look at and predict from. Consider the best way to engage all students in discussion of the graphs, i.e., hand them out altogether, one at a time, or set up six stations for groups of students to visit. Asking students to discuss and explain their thinking is a very important part of this session. The discussing and predicting allows teachers to assess student understanding and the amount of teaching needed.
Scatter Graph Samples, Copymaster 2, has the six scatter graphs for students to look at.
Use the following questions as part of the discussion. These will help students to answer the two questions on the sheet.
- What distance is the marble likely to roll if it was started from the top of the ramp? If the release height was 50 cm?
- Is the pattern (trend) linear, i.e., a straight line, or is the line through the middle of the points curved?
- Describe the overall trend of this ramp.
- Is there a starting position that will have the marble stop at 50 cm? 70 cm?
- Why are some distances clustered together closer than others?
- What is the range of distances are you absolutely sure the marble will stop at, given a set starting position?
- What is the range of distances you think the marble will stop at?
- On a scale from 1 to 10, how confident are you in your prediction? Explain why. Scale: 1 = not confident at all, 10 = extremely confident.
- Do scatter graphs with non-linear trends, i.e. curves, result from curved ramps? If not, why might curved prediction lines occur?
Sessions Four and Five
During this session the students are to build their ramps again with one aspect of it changed. The students could change the height and angle of the ramp, use marbles of different sizes or a golf ball could be used instead of the one marble, the surface the marble rolls on could be different, etc.
- Once their ramps have been changed they are to roll and record the distance the marble travels. Roll the marble:
- 5 times, release height 30 cm
- 5 times, release height 50 cm
- 5 times, release height 70 cm
- Graph the results on a scatter graph, then predict the distance the marble will travel when rolled from the release heights of 100 cm, 90 cm, and 80 cm. Predict the distance and state how accurate they think they are before starting the experiment. Adjustments to predictions are acceptable as the rolling and measuring continues, as long as they are accompanied by explanations.
-
This activity could be repeated several times with different changes made.
"What if . . ." questions could be posed to challenge students:
What if the ramps from Session One were two metres long, how long would the marble roll from the top of the ramp?
What if the ramps were curved?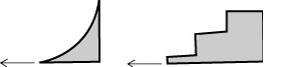
What if the surface was grass, concrete, or lino instead of carpet?
What if we rubbed the marble with a wax candle?
What if we measured time instead of distance for the marble to stop?
- Ask students to choose one of their experiments and produce a presentation describing what they did and what they found. This could be created in the form of a Google slide, infographic, video etc. Consider what will be appropriate and meaningful for your students. Discuss an appropriate layout for the poster:
- Title
- Description of the experiment
- Scatter graph with trend line (use digital technology if possible)
- Description of results
- Implication of the findings for real life rolling objects.
- At the end of Session Five students could present their posters to the rest of the class
Dear parents and whānau,
This week in maths we are investigating the distance a marble rolls along the floor when we roll it down a ramp.
Ask your child to tell you about what we did. Maybe you could build a ramp at home and try some experiments together.